20 3. Exercises (Part 3)
-


-
Last updated
- Dec 28, 2020
One Step Further: Skill-Building Cases
- Internet Project: Variable and Fixed Costs. Using the Internet, find the annual report of one retail company and one manufacturing company. Print out each company’s income statement. (Hint: The income statement is often called the statement of operations or statement of earnings.)
Required:
- Review each income statement, and provide an analysis of which operating costs are likely to be variable and which are likely to be fixed. Include copies of both income statements when submitting your answer.
- How would you expect a retail company’s mix of variable and fixed operating costs to differ from that of a manufacturing company?
- How might the managers of these companies use cost behavior information?
- Group Activity: Identifying Variable and Fixed Costs. To complete the following requirements, form groups of two to four students.
Required:
- Each group should select a product that is easy to manufacture.
- Prepare a list of materials, labor, and other resources needed to make the product.
- Using the list prepared in requirement b, identify whether the costs associated with each item are variable, fixed, or mixed.
- As a manager for this company, why would you want to know whether costs are variable, fixed, or mixed?
- Cost Behavior at Best Buy. The following condensed income statement is for Best Buy Co., Inc., a large retailer of consumer electronics.
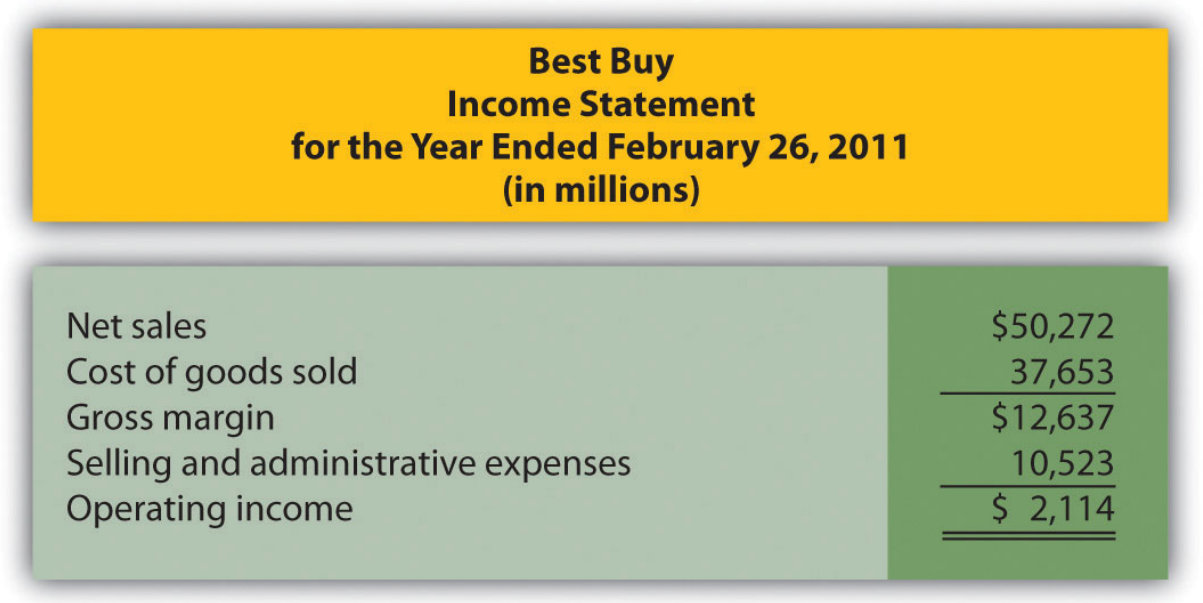
Note: Cost of Goods Sold above should read 37,635, not 37,653. Transposition error
Required:
Assume that cost of goods sold comprises only variable costs, and selling and administrative expenses are all fixed costs. Also assume that Best Buy expects sales to grow by 10 percent for the year ended March 3, 2012.
- Calculate expected operating income for the year ended March 3, 2012 assuming the company is still within the relevant range of activity.
- Calculate the expected percent increase in operating income from the year ended February 26, 2011, to the year ended March 3, 2012.
- Why is the percent increase in operating income higher than the percent increase in sales?
- Is the assumption that all selling and administrative expenses are fixed a reasonable assumption? Explain.
- Fixed Costs at United Airlines. Review Note 5.4 “Business in Action 5.1”.
Required:
- What is meant by the term fixed cost?
- Which costs at United Airlines were identified as fixed costs?
- How might United Airlines reduce its fixed costs? Be specific.
Comprehensive Case
- Ethics: Manipulating Data to Establish a Budget (Appendix). Healthy Bar, Inc., produces energy bars for sports enthusiasts. The company’s fiscal year ends on December 31. The production manager, Jim Wallace, is establishing a cost budget for the production department for each month of this coming quarter (January through March). At the end of March, Jim will be evaluated based on his ability to meet the budget for the three months ending March 31. In fact, Jim will receive a significant bonus if actual costs are below budgeted costs for the quarter.The production budget is typically established based on data from the last 18 months. These data are as follows:
| Reporting Period (Month) | Total Costs | Total Machine Hours |
|---|---|---|
| July | $695,000 | 3,410 |
| August | $700,000 | 3,454 |
| September | $665,000 | 2,453 |
| October | $725,000 | 3,740 |
| November | $655,000 | 2,442 |
| December | $672,500 | 2,695 |
| January | $687,500 | 2,937 |
| February | $715,000 | 3,652 |
| March | $625,000 | 2,200 |
| April | $632,500 | 2,244 |
| May | $650,000 | 2,255 |
| June | $702,500 | 3,520 |
| July | $730,000 | 3,542 |
| August | $735,000 | 3,597 |
| September | $697,500 | 2,552 |
| October | $762,500 | 3,894 |
| November | $687,500 | 2,541 |
| December | $705,000 | 2,805 |
You are the accountant who assists Jim in preparing an estimate of production costs for the next three months. You intend to use regression analysis to estimate costs, as was done in the past. Jim expects that 3,100 machine hours will be used in January, 3,650 machine hours in February, and 2,850 machine hours in March.
Jim approaches you and asks that you add $100,000 to production costs for each of the past 18 months before running the regression analysis. As he puts it, “After all, management always takes my proposed budgets and reduces them by about 10 percent. This is my way of leveling the playing field!”
Required:
- Use Excel to perform regression analysis using the historical data provided.
- Submit a printout of the results.
- Use the regression output to develop the cost equation Y=f+vX by filling in the dollar amounts for f and v.
- Calculate estimated production costs for January, February, and March. Also provide a total for the three months.
2. Use Excel to perform regression analysis after adding $100,000 to production costs for each of the past 18 months, as Jim requested.
-
- Submit a printout of the results.
- Use the regression output to develop the cost equation Y=f+vX by filling in the dollar amounts for f and v
- Calculate estimated production costs for January, February, and March. Also provide a total for the three months.
3. Why did Jim ask you to add $100,000 to production costs for each of the past 18 months?
4. How should you handle Jim’s request? (If necessary, review the presentation of ethics in Chapter 2 for additional information.)
