81 12.5: Direct Labor Variance Analysis
-


-
Last updated
- Dec 28, 2020
Learning Objectives
- Calculate and analyze direct labor variances.
Question: In addition to investigating the causes of cost overruns for direct materials, the president of Jerry’s Ice Cream wants to know why there were cost overruns for direct labor. What variances are used to analyze these types of direct labor cost overruns?
At Jerry’s Ice Cream, the actual data for the year are as follows:
| Sales volume | 210,000 units |
| Direct labor hours worked | 18,900 hours |
| Cost of direct labor | $15 per hour |
Recall from Figure 12.1 that the standard rate for Jerry’s is $13 per direct labor hour and the standard direct labor hours is 0.10 per unit. Figure 10.6 shows how to calculate the labor rate and efficiency variances given the actual results and standards information. Review this figure carefully before moving on to the next section where these calculations are explained in detail.
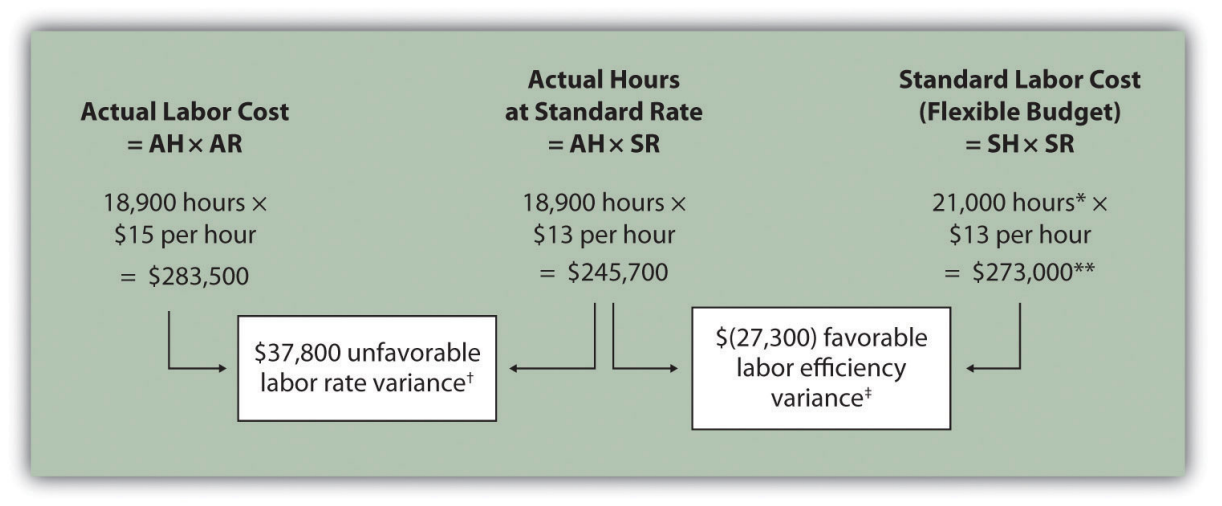
Note: AH = Actual hours of direct labor. AR = Actual rate incurred for direct labor . SR = Standard rate for direct labor. SH = Standard hours of direct labor for actual level of activity.
**$273,000 standard direct labor cost matches the flexible budget presented in Figure 12.2.
† $37,800 unfavorable labor rate variance = $283,500 – $245,700. Variance is unfavorable because the actual rate of $15 is higher than the expected (budgeted) rate of $13.
‡ $(27,300) favorable labor efficiency variance = $245,700 – $273,000. Variance is favorable because the actual hours of 18,900 are lower than the expected (budgeted) hours of 21,000.
Direct Labor Rate Variance Calculation
Question: The direct labor rate variance answers the question, did we spend more or less on direct labor than expected? If the variance is unfavorable, we spent more than expected. If the variance is favorable, we spent less than expected. How is the labor rate variance calculated?
Direct Labor Efficiency Variance Calculation
Question: The direct labor efficiency variance answers the question, did we use more or less direct labor hours in production than expected? If the variance is unfavorable, we used more than expected. If the variance is favorable, we used less than expected. How is the labor efficiency variance calculated?
Possible Causes of Direct Labor Variances
Question: The managerial accountant at Jerry’s Ice Cream is interested in finding the cause of the unfavorable labor rate variance of $37,800. Jerry’s Ice Cream might also choose to investigate the $27,300 favorable labor efficiency variance. Although this could be viewed as good news for the company, management may want to know why this favorable variance occurred. What might have caused the $37,800 unfavorable labor rate variance and $27,300 favorable labor efficiency variance?
- Answer
Business in action 12.3 – Labor Costs in the Airline Industry
United Airlines asked a bankruptcy court to allow a one-time 4 percent pay cut for pilots, flight attendants, mechanics, flight controllers, and ticket agents. The pay cut was proposed to last as long as the company remained in bankruptcy and was expected to provide savings of approximately $620,000,000. How would this unforeseen pay cut affect United’s direct labor rate variance? The direct labor rate variance would likely be favorable, perhaps totaling close to $620,000,000, depending on how much of these savings management anticipated when the budget was first established.

© Thinkstock
After filing for Chapter 11 bankruptcy in December 2002, United cut close to $5,000,000,000 in annual expenditures. As a result of these cost cuts, United was able to emerge from bankruptcy in 2006.
Source: Associated Press, “United May Seek End to Union Contracts,” USA Today, November 25, 2004.
Follow-Up Meeting at Jerry’s Ice Cream
Jerry (president and owner), Tom (sales manager), Lynn (production manager), and Michelle (treasurer and controller) were at the meeting described at the opening of this chapter. Michelle was asked to find out why direct labor and direct materials costs were higher than budgeted, even after factoring in the 5 percent increase in sales over the initial budget. Lynn was surprised to learn that direct labor and direct materials costs were so high, particularly since actual materials used and actual direct labor hours worked were below budget.
The group met again a week later to discuss the issue.
| Jerry: | Michelle, what do you have for us? |
| Michelle: |
My staff has been working hard to identify why direct materials and direct labor costs were higher than expected. First, I would like to confirm that these costs were indeed higher than anticipated.
|
| Lynn: | I still don’t see how this can be. My production crew was as efficient with their time and materials as they’ve ever been. |
| Michelle | You’re right, Lynn. Our variance analysis shows a favorable direct materials quantity variance, which relates directly to the amount of materials used, and a favorable direct labor efficiency variance, which relates directly to the efficiency of our production workers. Both variances are good news. |
| Jerry: | Then why are our direct labor and direct materials costs so high? |
| Michelle: | The answer relates directly to the price we paid for materials, and the hourly rates we paid for labor. Both were higher than expected. We expected to pay $1 per pound for direct materials , but actually paid $1.20 per pound. In addition, we expected to pay $13 an hour for direct labor when in fact we actually paid $15 an hour. This means we paid 20 percent more than expected for
direct materials , which is $0.20 divided by $1, and 15 percent more than expected for direct labor , which is $2 divided by $13.
|
| Lynn: | I do recall Tony over in purchasing telling me he obtained some premium materials for our ice cream, and I know we hired some relatively experienced workers who were paid a bit more than the normal starting rate. |
| Tom: | This might explain why our customers were thrilled about our product. The materials were high quality and the production workers really knew their stuff |
| Jerry: | While I like the end result of a higher-quality product and increased sales, we must do a better job of controlling costs. Perhaps Tony can negotiate a better price for materials. I don’t mind paying our employees a higher wage based on their experience, but let’s make sure we get some efficiency savings in the process to help offset the higher wages. Michelle, can we continue to monitor material and labor costs? |
| Michelle: | Yes. I’ll have my staff analyze material and labor variances monthly, and I’ll have a report ready at the end of each month for you and Lynn. |
| Jerry: | Excellent! Lynn, let our production crew know they are doing a fine job, and continue to encourage them to find ways to improve the efficiency of production. I’ll talk with Tony about the possibility of getting a better deal on materials. |
As stated earlier, variance analysis is the control phase of budgeting. Using variance analysis for direct materials and direct labor, Jerry’s Ice Cream was able to identify strong points in its operations (quantity of materials used and efficiency of direct labor workforce), and perhaps more important, Jerry’s was able to identify problem areas (price paid for materials and wages paid to employees). This information gives the management a way to monitor and control production costs. Next, we calculate and analyze variable manufacturing overhead cost variances.
Key Takeaway
Carol’s Cookies expected to use 0.20 direct labor hours to produce 1 unit (batch) of product at a cost of $12 per hour. Actual results are in for last year, which indicates 390,000 batches of cookies were sold. The company’s direct labor workforce worked 97,500 hours at $11 per hour.
- Calculate the labor rate and efficiency variances using the format shown in Figure 12.6.
- Use the alternative approach to calculating the labor rate and efficiency variances, and compare the result to the result in part 1. (Hint: the variances should match.)
- Suggest several possible reasons for the labor rate and efficiency variances.
- Answer
Definitions
- The difference between actual costs for direct labor and budgeted costs based on the standards.
- The difference between the actual number of direct labor hours worked and budgeted direct labor hours that should have been worked based on the standards.
