36 5.6 Chapter Wrap-Up- Summary of Cost Flows at Custom Furniture Company
-


-
Last updated
- Dec 28, 2020
Learning Objectives
- Use a job costing system to track costs and evaluate profitability for each job
Question: The goal of this section is to pull it all together for Custom Furniture Company. We begin by looking at revenue and cost information for May, including manufacturing and nonmanufacturing costs. Why is it important for companies like Custom Furniture Company to correctly classify and record costs such as direct materials (e.g., wood used for each table), salaries of administrative personnel, and rent on the factory?
Revenue and Cost Information for Custom Furniture Company
Question: How are the typical transactions for a manufacturing company recorded in the general journal?
-
Question: Now that the information for the month of May has been recorded for Custom Furniture Company, we need to summarize this information to evaluate the profitability of the company and the profitability of jobs. How profitable was Custom Furniture for the month of May?
Analysis of Job Profitability at Custom Furniture Company
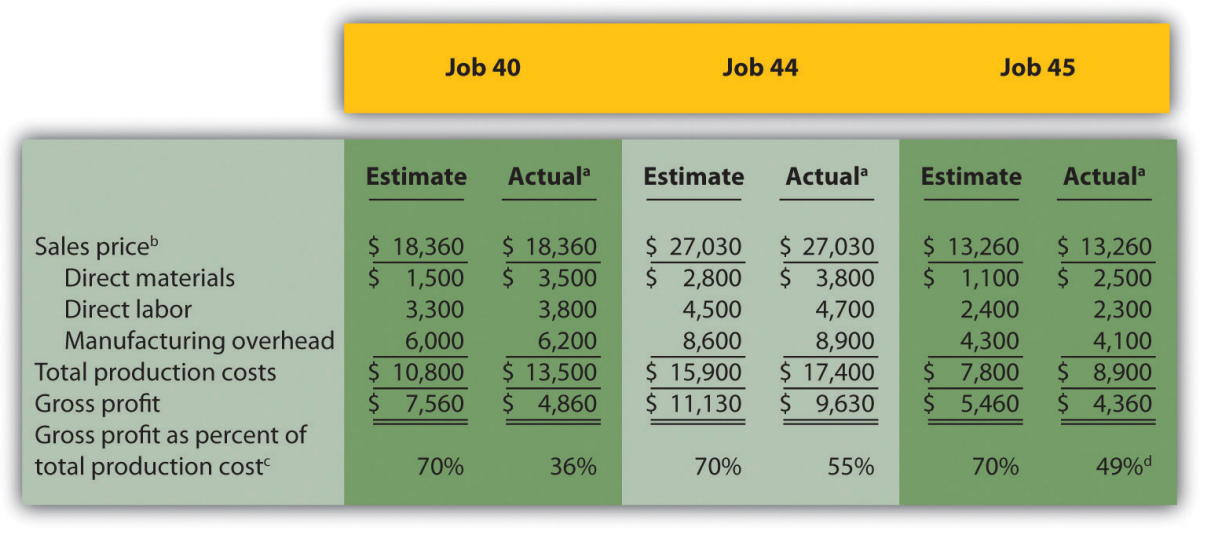
Recall from the beginning of the chapter that Dan Stevens, the owner of Custom Furniture Company, is concerned about the company’s profitability. Although Dan prices his furniture at 70 percent above estimated production costs, the company had only $11,000 in profits for the month of May, as shown in Figure 5.9. Dan asked Leslie (the accountant) to look into the accuracy of his estimates by reviewing actual production costs for the three costliest tables produced in May. As you read Leslie’s comments, be sure to look at the income statement in Figure 5.9 and the job cost estimates and actual results in Figure 5.10.
| Leslie: | Dan, I have the production cost information you requested. |
| Dan: | Great! What did you find out? |
| Leslie: | Well, first I looked at the income statement for May. If you establish prices based on a 70 percent markup of production costs, then sales revenue should be 170 percent of cost of goods sold, and the resulting gross profit should be 70 percent of cost of goods sold. |
| Dan: | Sounds reasonable. Are we anywhere near these numbers? |
| Leslie: | Not really. Cost of goods sold for May total $135,000, so sales should be closer to $229,500 (that would be $135,000 times 170 percent), and gross profit should be closer to $94,500, which is $135,000 times 70 percent. As you can see on the income statement, we didn’t get very close to these numbers. |
| Dan: | Do you have any idea why? |
| Leslie: | I pulled together production cost information from our job costing system for the three highest-cost tables produced in May as you requested. |
| Dan: | And? |
| Leslie: | I compared the job cost sheet information for each item with your original estimates, and here’s what I found. It looks as if the problem is with direct materials. All three jobs show that direct material costs were significantly higher than you estimated. Direct labor and manufacturing overhead costs were pretty close. |
| Dan: | Wow, I’m surprised that direct material costs were so high. I’ll have to check into this further. I do recall wood costs increasing over the last couple of months, but not to this extent. |
| Leslie: | There are lots of potential causes for the increase in direct materials. Perhaps materials were wasted as a result of machine problems or because of inexperienced employees. |
| Dan: | Let’s try to nail down why my estimates are so far off so I can do a better job of estimating costs in the future. |
| Leslie: | Good idea—I’ll look into the direct materials costs and get back to you later this week. |
Question: Figure 5.10 provides an in-depth view of the costs associated with each job and the resulting profitability. How does this information help Custom Furniture Company plan for the future?
Key Takeaway
-
Job costing systems can do more than simply track the costs of each job. Companies also use these systems to track revenue and the resulting profit for each job.
- A job costing system can be used to identify areas of concern by comparing the cost estimate prepared before starting the
job with information on the completed job cost sheet. This type of analysis often leads to changes in the production process and revised estimates for future jobs.
Review problem 5.5
Farm Equipment, Inc., produces tractors and other farm machinery. Each piece of equipment is built to customer specifications. During May, its first month of operations, Farm Equipment, Inc., began working on three customer orders: jobs 1, 2, and 3. The following transactions occurred during May:
- Purchased production materials on account totaling $450,000
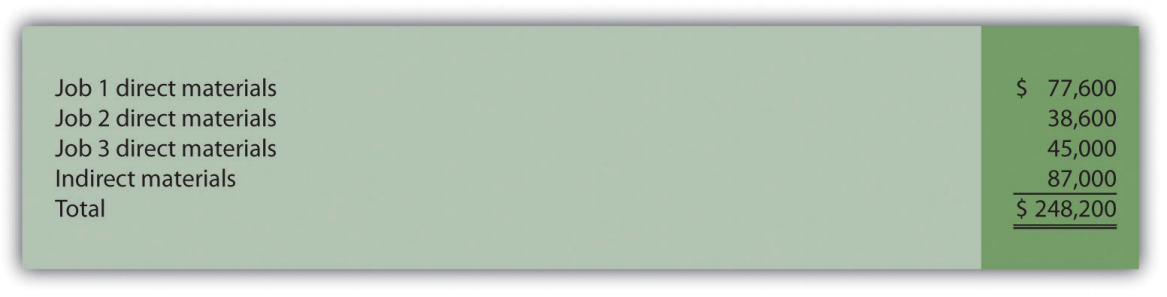
- Processed material requisitions for the following items:
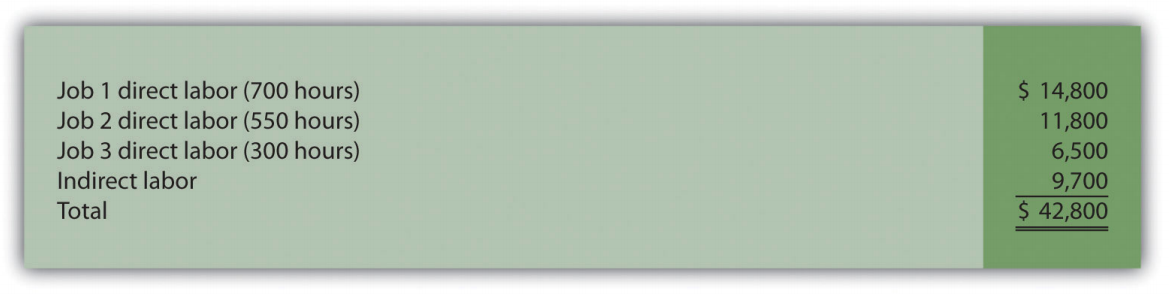
- Processed timesheets showing the following:
- Applied overhead using a predetermined rate of 160 percent of direct labor cost
- Completed job 1 and transferred it to finished goods
- Delivered job 1 to the customer and billed her $140,000. (Hint: Two entries are required—one for the cost of the goods and another for the revenue.)
Required:
- Calculate the production costs incurred in May for each of the three jobs.
- Make the appropriate journal entry for each item described previously. Assume all payments will be made next month. (Hint: Use Figure 5.7 as a guide.)
- How much gross profit did Farm Equipment, Inc., earn from the sale of job 1?
- Assuming selling costs totaled $4,000 and general and administrative costs totaled $11,000 in May, prepare an income statement for Farm Equipment, Inc., for the month. (Assume there is no adjustment to cost of goods sold for underapplied or overapplied overhead.)
