14 3.3 Cost Estimation Methods


- Last updated
- Dec 28, 2020
Learning Objectives
- Estimate costs using account analysis, the high-low method, the scattergraph method, and regression analysis.
Question: Recall the conversation that Eric (CFO) and Susan (cost accountant) had about Bikes Unlimited’s budget for the next month, which is August. The company expects to increase sales by 10 to 20 percent, and Susan has been asked to estimate profit for August given this expected increase. Although examples of variable and fixed costs were provided in the previous sections, companies typically do not know exactly how much of their costs are fixed and how much are variable. (Financial accounting systems do not normally sort costs as fixed or variable.) Thus organizations must estimate their fixed and variable costs. What methods do organizations use to estimate fixed and variable costs?
-
-
Account Analysis
Question: The account analysis7 approach is perhaps the most common starting point for estimating fixed and variable costs. How is the account analysis approach used to estimate fixed and variable costs?
- Answer test of “presentation format H5P below
Question: Why should Susan be careful using historical data for one month (June) to estimate future costs?
-
-
Review problem 3.2
Alta Production, Inc., is using the account analysis approach to identify the behavior of production costs for a month in which it produced 350 units. The production manager was asked to review these costs and provide her best guess as to how they should be categorized. She responded with the following information:
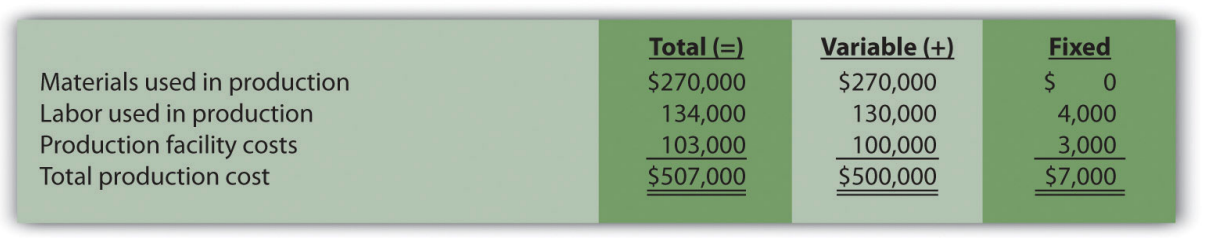
- Describe the production costs in the equation form Y = f + vX
- Assume Alta intends to produce 400 units next month. Calculate total production costs for the month.
Question: Another approach to identifying fixed and variable costs for cost estimation purposes is the high-low method8. Accountants who use this approach are looking for a quick and easy way to estimate costs, and will follow up their analysis with other more accurate techniques. How is the high-low method used to estimate fixed and variable costs?
Question: How are the four steps of the high-low method used to estimate total fixed costs and per unit variable cost?
Question: Although the high-low method is relatively simple, it does have a potentially significant weakness. What is the potential weakness in using the high-low method?
-
-
Review problem 3.3
Alta Production, Inc., reported the following production costs for the 12 months January through December. (This is the same company featured in Note 3.15 “Review Problem 3.2”.)
| Reporting Period (Month) | Total Production Costs | Level of
Activity
(Units Produced) |
|---|---|---|
| January | $460,000 | 300 |
| February | $300,000 | 220 |
| March | $480,000 | 330 |
| April | $550,000 | 390 |
| May | $570,000 | 410 |
| June | $310,000 | 240 |
| July | $440,000 | 290 |
| August | $455,000 | 320 |
| September | $530,000 | 380 |
| October | $250,000 | 150 |
| November | $700,000 | 450 |
| December | $490,000 | 350 |
- Using this information, perform the four steps of the high-low method to estimate costs and state your results in cost equation form Y = f + vX
- Assume Alta Production, Inc., will produce 400 units next month. Calculate total production costs for the month.
- What is the potential weakness in using this approach to estimate costs?
Scattergraph Method
Question: Many organizations prefer to use the scattergraph method9 to estimate costs. Accountants who use this approach are looking for an approach that does not simply use the highest and lowest data points. How is the scattergraph method used to estimate fixed and variable costs?
Question: How are the five steps of the scattergraph method used to estimate total fixed costs and per unit variable cost?
Question: Remember that the key weakness of the high-low method discussed previously is that it considers only two data points in estimating fixed and variable costs. How does the
Review problem 3.4
Alta Production, Inc., reported the following production costs for the 12 months January through December. (These are the same data presented in Note 3.17 “Review Problem 3.3”.)
| Reporting Period (Month) | Total Production Costs | Level of
Activity
(Units Produced) |
|---|---|---|
| January | $460,000 | 300 |
| February | $300,000 | 220 |
| March | $480,000 | 330 |
| April | $550,000 | 390 |
| May | $570,000 | 410 |
| June | $310,000 | 240 |
| July | $440,000 | 290 |
| August | $455,000 | 320 |
| September | $530,000 | 380 |
| October | $250,000 | 150 |
| November | $700,000 | 450 |
| December | $490,000 | 350 |
- Using the information, perform the five steps of the scattergraph method to estimate costs and state your results in cost equation form Y=f+vX
- Assume Alta Production, Inc., will produce 400 units next month. Calculate total production costs for the month.
- When is this approach likely to yield more accurate results than the high-low method?
-
- Regression Analysis
Question:
Review problem 3.5
Alta Production, Inc., reported the following production costs for the 12 months January through December. (These are the same data that appear in Note 3.17 “Review Problem 3.3” and Note 3.19 “Review Problem 3.4”.)
| Reporting Period (Month) | Total Production Cost | Level of
Activity
(Units Produced) |
|---|---|---|
| January | $460,000 | 300 |
| February | $300,000 | 220 |
| March | $480,000 | 330 |
| April | $550,000 | 390 |
| May | $570,000 | 410 |
| June | $310,000 | 240 |
| July | $440,000 | 290 |
| August | $455,000 | 320 |
| September | $530,000 | 380 |
| October | $250,000 | 150 |
| November | $700,000 | 450 |
| December | $490,000 | 350 |
| Coefficients | |
| y-intercept | 703 |
| x variable | 1,442.97 |
- Using this information, create the cost equation in the form Y = f + vX
- Assume Alta Production, Inc., will produce 400 units next month. Calculate total production costs for the month.
Summary of Four Cost Estimation Methods
Question: You are now able to create the cost equation Y=f+vX to estimate costs using four approaches. What does the cost equation look like for each approach at Bikes Unlimited?
Question: We have seen that different methods yield different results, so which method should be used?
At Bikes Unlimited, Eric (CFO) and Susan (cost accountant) met several days later. After consulting with her staff, Susan agreed that regression analysis was the best approach to use in estimating total production costs (keep in mind nothing has been done yet with selling and administrative expenses). Account analysis was ruled out because no one on the accounting staff had been with the company long enough to review the accounts and determine which costs were variable, fixed, or mixed. The high-low method was ruled out because it only uses two data points and Eric would prefer a more accurate estimate. Susan did request that her staff prepare a scattergraph and review it for any unusual data points before performing regression analysis. Based on the scattergraph prepared, all agreed that the data was relatively uniform and no outlying data points were identified.
| Susan: | My staff has been working hard to determine what will happen to profit if sales volume increases. So far, we’ve been able to identify cost behavior patterns for production costs, and we’re currently working on the cost behavior patterns for selling and administrative expenses. |
| Eric: | What do you have for production costs? |
| Susan: | The portion of production costs that are fixed—that won’t change with changes in production and sales—totals $43,276. The portion of production costs that are variable—that vary with changes in production and sales—totals $53.42 per unit. |
| Eric: | When do you expect to have further information for the selling and administrative costs? |
| Susan: | We should have those results by the end of the day tomorrow. At that point, I’ll put together an income statement projecting profit for August. |
| Eric: | Sounds good. Let’s meet when you have the information ready. |
Key Takeaway
-
Account analysis requires that a knowledgeable employee (or group of employees) determine whether costs are fixed, variable, or mixed. If employees do not have enough experience to accurately estimate these costs, another method should be used.
- Table 5.1 and Figure 5.1 show that total variable costs change with changes inactivity, but per unit variable cost does not change with changes in activity. Table 3.2 and Figure 3.2 show that total fixed costs do not change with changes inactivity, but per unit fixed costs do change with changes in activity. Table 3.3 and Figure 3.3 show that total mixed costs change with changes inactivity, and per unit mixed cost also changes with changes in activity.
- The high-low method starts with the highest and lowest activity levels and uses four steps to estimate fixed and variable costs.
- The scatter graph method has five steps and starts with plotting all points on a graph and fitting a line through the points. This line represents costs throughout a range of activity levels and is used to estimate fixed and variable costs. The scattergraph is also used to identify any outlying or unusual data points.
-
Regression analysis forms a mathematically determined line that best fits the data points. Software packages like Excel are available to perform regression analysis. As with the account analysis, high-low, and scattergraph methods, this line is described in the equation form Y=f+vX. This equation is used to estimate future costs.
-
Four methods can be used to estimate fixed and variable costs. Each method has its advantages and disadvantages, and the choice of a method will depend on the situation at hand. Experienced employees may be able to effectively estimate fixed and variable costs by using the account analysis approach. If a quick estimate is needed, the high-low method may be appropriate. The scattergraph method helps with identifying any unusual data points, which can be thrown out when estimating costs. Finally, regression analysis can be run using computer software such as Excel and generally provides for more accurate cost estimates.
Review problem 3.6
Use the solutions you prepared for Note 3.15 “Review Problem 3.2”, Note 3.17 “Review Problem 3.3”, Note 3.19 “Review Problem 3.4”, and Note 3.21 “Review Problem 3.5” to do the following:
- Show the four cost equations created for Alta Production, Inc., using account analysis (Note 3.15 “Review Problem 3.2”), the high-low method (Note 3.17 “Review Problem 3.3”), the scattergraph method (Note 3.19 “Review Problem 3.4”), and regression analysis (Note 3.21 “Review Problem 3.5”).
- Using the four equations listed in your answer to 1, calculate total production costs assuming Alta Production, Inc., will produce 400 units next month. Comment on your results.
Definitions
- A method of cost analysis that requires a review of accounts by an experienced employee or group of employees to determine whether the costs in each account are fixed or variable.
- A method of cost analysis that uses the high and low activity data points to estimate fixed and variable costs
- A method of cost analysis that uses a set of data points to estimate fixed and variable costs.
- A method of cost analysis that uses a series of mathematical equations to estimate fixed and variable costs; typically done using computer software.
