82 12.6: Variable Manufacturing Overhead Variance Analysis
-


-
Last updated
- Dec 28, 2020
Learning Objectives
- Calculate and analyze variable manufacturing overhead variances.
Question: Similar to direct materials and direct labor variances, variable manufacturing overhead variance analysis involves two separate variances. What are the two variances used to analyze the difference between actual variable overhead costs and standard variable overhead costs?
At Jerry’s Ice Cream, the actual data for the year are as follows:
| Sales volume | 210,000 units |
| Direct labor hours worked | 18,900 hours |
| Total cost of variable overhead | $100,000 |
Recall from Figure 12.1 that the variable overhead standard rate for Jerry’s is $5 per direct labor hour and the standard direct labor hours is 0.10 per unit. Figure 12.8 shows how to calculate the variable overhead spending and efficiency variances given the actual results and standards information. Review this figure carefully before moving on to the next section where these calculations are explained in detail.

Note: AH = Actual hours of direct labor. (This measure will depend on the allocation base that the company uses. Jerry’s uses direct labor hours to allocate variable manufacturing overhead, so AH refers to actual direct labor hours.) SR = Standard variable manufacturing overhead rate per direct labor hour. SH = Standard hours of direct labor for actual level of activity.
*Since variable overhead is not purchased per direct labor hour, the actual rate (AR) is not used in this calculation. Simply use the total cost of variable manufacturing overhead instead.
** Standard hours of 21,000 = Standard of 0.10 hours per unit × 210,000 actual units produced and sold.
† $105,000 standard variable overhead costs matches the flexible budget presented in Figure 12.2.
‡ $5,500 unfavorable variable overhead spending variance = $100,000 – $94,500. Variance is unfavorable because the actual variable overhead costs are higher than the expected costs given actual hours of 18,900.
§ $(10,500) favorable variable overhead efficiency variance = $94,500 – $105,000. Variance is favorable because the actual hours of 18,900 are lower than the expected (budgeted) hours of 21,000.
Variable Overhead Spending Variance Calculation
Question: How is the variable overhead spending variance calculated?
Variable Overhead Efficiency Variance Calculation
Question: How is the variable overhead efficiency variance calculated?
Possible Causes of Variable Manufacturing Overhead Variances
Question: The managerial accountant at Jerry’s Ice Cream is interested in finding the cause of the unfavorable variable overhead spending variance of $5,500. The spending variance can result from variances in the cost of variable overhead items and the usage of these items. What might have caused the $5,500 unfavorable variable overhead spending variance?
- Answer
-
The left panel of Figure 12.9 contains some possible explanations for Jerry’s unfavorable overhead spending variance.
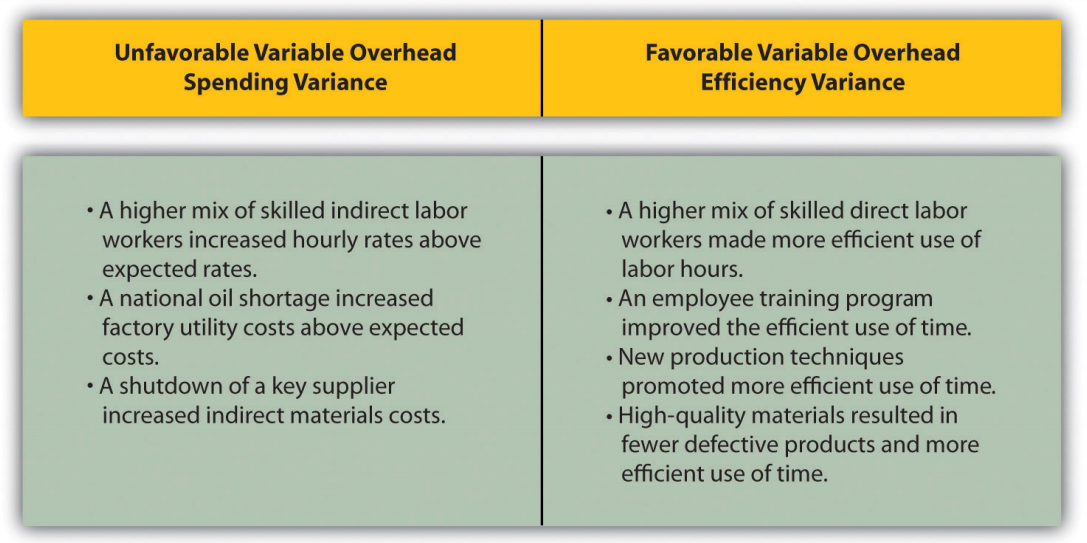
Figure 12.9: – Possible Causes of Variable Manufacturing Overhead Variances for Jerry’s Ice Cream
Question: Jerry’s Ice Cream might also choose to investigate the $10,500 favorable variable overhead efficiency variance. What might have caused the $10,500 favorable variable overhead efficiency variance?
Business in action 12.4 – Hiding Fraud in Overhead Accounts
The controller of a small, closely held manufacturing company embezzled close to $1,000,000 over a 3-year period. With annual revenues of $30,000,000 and less than 100 employees, the company certainly felt the impact of losing $1,000,000.
The forensic accountant who investigated the fraud identified several suspicious transactions, all of which were charged to the manufacturing overhead account. To prevent this type of fraud in the future, the forensic accountant recommended that “significant manufacturing overhead variances be analyzed both within and across time periods to identify anomalies.” Apparently, the company was not closely monitoring manufacturing overhead variances when the fraud occurred.
Source: John B. MacArthur, Bobby E. Waldrup, and Gary R. Fane, “Caution: Fraud Overhead,” Strategic Finance, October 2004, 28–32.
Key Takeaway
Review problem 12.5
Carol’s Cookies expected to use 0.20 direct labor hours to produce 1 unit (batch) of product, and the variable overhead rate is $3.50 per hour. Actual results are in for last year, which indicates 390,000 batches of cookies were produced and sold. The company’s direct labor workforce worked 97,500 hours, and variable overhead costs totaled $360,000.
- Calculate the variable overhead spending and efficiency variances using the format shown in Figure 12.8.
- Suggest several possible reasons for the variable overhead spending and efficiency variances.
- Answer
Definitions
- The difference between actual costs for variable overhead and budgeted costs based on the standards.
- The difference between the actual activity level in the allocation base (often direct labor hours or machine hours) and the budgeted activity level in the allocation base according to the standards.
