Hearing in Complex Environments
71
Learning Objectives
Be able to describe what spectrogram (time-frequency plot) is.
Know the definition of formants and transitions.
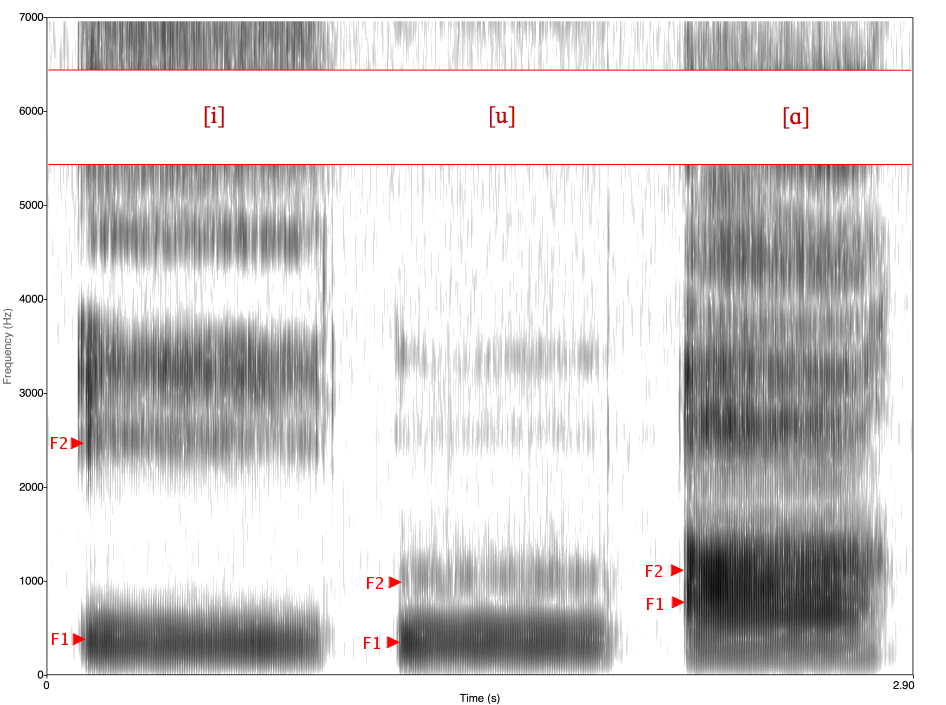
Time-frequency analysis shows up a lot. For speech, when we visualize the evolving frequency composition of sounds, it is called a spectrogram. Spectrograms are used extensively in the fields of music, linguistics, sonar, radar, speech processing, seismology, and more. Spectrograms of audio can be used to identify spoken words phonetically, and to analyze the various calls of animals. For music, this is the graphic equalizer on a stereo. On spectrograms (time-frequency plots) of speech, there are bands of power at different frequencies. These are formants. As the speaker changes the sound it is making, the power bands swoop up and down. These are transitions.
Cheryl Olman PSY 3031 Detailed Outline
Provided by: University of Minnesota
Download for free at http://vision.psych.umn.edu/users/caolman/courses/PSY3031/
License of original source: CC Attribution 4.0
Adapted by: Samuel KwongWikipedia, Spectrogram
Provided by: Wikipedia
URL: https://en.wikipedia.org/wiki/Spectrogram
License: CC BY-SA 3.0
Adapted by: Samuel Kwong
