Hearing Loss and Central Auditory Processing
56
Learning Objectives
Know the frequencies that are most affected by age-related hearing loss.
Know the term for the condition of age-related hearing loss.
Be able to discuss possible sex differences.
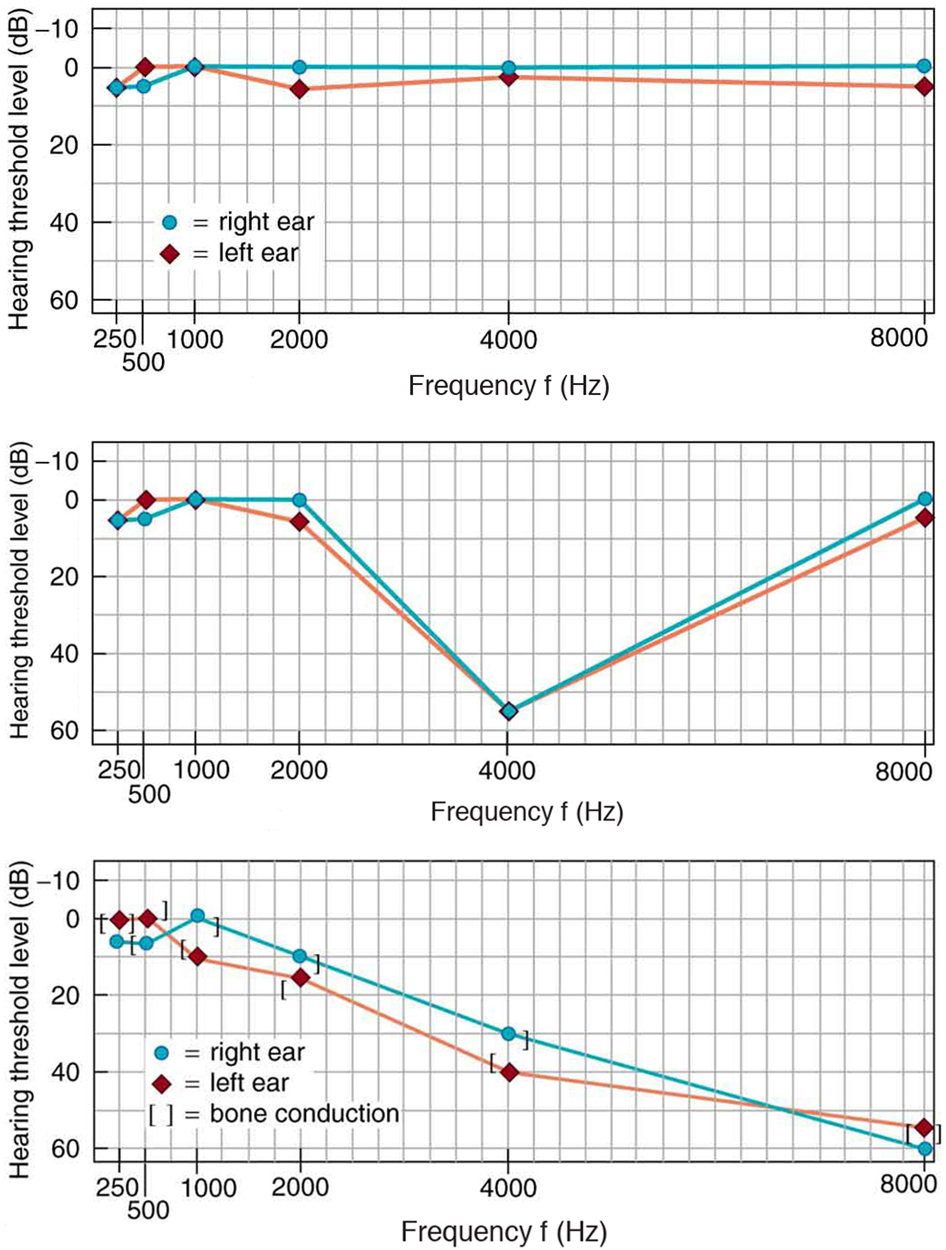
Hearing tests are performed over a range of frequencies, usually from 250 to 8000 Hz, and can be displayed graphically in an audiogram shown below. Audiograms are used to measure adults by raising your right or left hand (or pushing a button) to indicate when you hear a sound by your right ear or left ear while wearing headphones. The hearing threshold is measured in dB relative to the normal threshold, so that normal hearing registers as 0 dB at all frequencies. Hearing loss caused by noise typically shows a dip near the 4000 Hz frequency, irrespective of the frequency that caused the loss, and often affects both ears. The most common form of hearing loss comes with age and is called presbycusis—literally “elder ear.” Such loss is increasingly severe at higher frequencies and interferes with music appreciation and speech recognition.
High frequencies (above ~5kHz) are also affected by aging. It appears that men experience greater hearing loss than women. Perhaps it is because men are historically subjected to louder environments, but we won’t know until a new generation ages. In one study of males and females on Easter Island, where roads and jack hammers and other common auditory insults from the urban environment are absent, elderly males did not show greater hearing loss than elderly females. However, this study is not broadly accepted or replicated. Additionally, otoacoustic emissions are stronger in females than in males. So we know there are some differences between genders, but we do not know how much these differences are caused by biological factors or social factors or how they may play out in day-to-day hearing.

CC LICENSED CONTENT, SHARED PREVIOUSLY
OpenStax, College Physics for AP Courses Chapter 17.6 Hearing
Provided by: Rice University.
Access for free at https://openstax.org/books/college-physics-ap-courses/pages/1-connection-for-ap-r-courses
License: CC-BY 4.0
Cheryl Olman PSY 3031 Detailed Outline
Provided by: University of Minnesota
Download for free at http://vision.psych.umn.edu/users/caolman/courses/PSY3031/
License of original source: CC Attribution 4.0
Adapted by: Aliciana Bezdicek and John Bates

