4 Chapter 4. Virtually there!
Learning Objectives
Once in the field it might be a little overwhelming to know where to start. At the end of this chapter the student will
- have a clear idea about a step by step process to field data collecting.
- understand the relevance of the details observed.
4.1. Introduction
Remember the feeling of reading a chapter book for the first time? You start obviously with Chapter 1 eager to dive into the story. But reading just the first line is not going to be enough to have a clear idea about the storyline, about the characters or the relationships between them. Page by page, clue by clue, the story of the chapter comes into focus and by the end of the chapter you can probably summarize in one sentence what the chapter was about. Yet, it is just a portion of the story; an allusion, a feeling, and at the end you might have even more questions than answers. All the other connection pieces are going to be revealed one by one, chapter by chapter. And together, all the chapters contribute to create a clear picture that allows you to understand the story.
It is the same approach when dealing with a geological sequence. Every geological unit is like a chapter in a book. For each chapter you have to collect your evidence and follow the clues hidden in the rocks to decipher this part of the story. But together, all the data collected about the studied units create a big picture that encompasses millions of years of geological processes, geomorphological changes and plants and animals evolution.
Before we start deciphering the geological history of the Late Cretaceous Eastend Formation, the last formation deposited in the Avonlea Badlands area, remember that in the field you should pay attention to all the details, even if they might not make a lot of sense. It is easier to generalize when you have a lot of details than to extract details from a very general description!
4.2. So… how do I start?
It is easier to talk about how to start a research study in the field and have the theoretical aspects nailed down. The reality is that in the field you’ll probably feel overwhelmed. Where to start? Which details shall be noted first? Is this aspect more important than the other one? Should we start at the top or at the bottom of the sequence? Are these features important? Do we split the team so we can work faster? What if we forgot something?
To all these question, we usually have one answer that it is more of a question than an answer. We look at the worried faces of the overwhelmed team and we ask them: “How do you eat a white elephant?”. Peoples’ reaction is of utter confusion and then we answer to them: “Bite by bite. With taking notes for scientific purposes it is the same. Clue by clue, one manages to understand completely the story. The trick is to breathe in and out, follow a pattern to make sure you do not forget anything, and let the story reveal to you instead of forcing it to happen.”
There are though, a few questions that we should insist on. But, please keep in mind that these are only suggested answers based on personal experience.
One of these questions is “Shall we start at the top or at the bottom of the sequence?”. The short answer is that both approaches should bare the same result. Yet, starting at the bottom of the sequence tends to be the more favoured approach, as it follows the order of the depositional events, moving in a linear manner through time from older to newer sediments. Hint for the future: if you’ll ever be in the situation to describe a core, the same question will pop-up. With the same answer.
The other question to which we’ll pay a little bit more attention in this part is “Do we split the team so we can work faster?”. The ideal situation would be for all your team members to work together at least for the collection of data for the first vertical section. In some cases, all of you might work together for the first time and you could use this time to know each other. It is also the time that you can use to develop a research protocol making sure that all the aspects of the data collection are covered. If time permits, work together. But if the time is a crunch, you can split the team to cover more ground. Just make sure that all the mini groups of the team are following the same data collection protocol. Trust us, it will make it so much easier when your team will have to compile all the information in order to recreate the past depositional environment. One thing to remember is that faster is not always the answer. Might be faster to collect data in a random order, but you’ll forget things and when the time will come to analyze and interpret your data, you’ll find yourself spending more time trying to organize your data than to process it. The final decision lays with the team, always.
4.2.1. How do you eat a white elephant?
4.2.1.1. First bite: observe from far away
Your first “bite” into the project, should be to observe the study area from far away. Not from kilometres away, but rather from a distance that will allow you to see it all. In your field notebook you should sketch the overview of the area adding all the major units that you can recognize from that distance, all the layers that are continuous along the section, if there are major changes in colours or lithology, presence of structural elements such as faults, and presence or absence of vegetation. Note that we said sketch and not take a picture. Drawing a sketch is a way to enhance what you see. Taking the time to really look at the units, observe the changes, and note the relationships between different units will pay off during the interpretations stages. Yes, a picture is faster and pictures should be taken while in the field. But the pictures should not replace the sketches.
As a side note, we have to warn you. There will be a moment in which you’ll think that you’ll take a picture and then you’ll do the sketch later and the result will be the same. Do not give in to the temptation! The camera, no matter how performant, will never capture the subtle changes in colours or the orientation of the outcrop. Depending the time of the day when you take the pictures, you might have shadows that you won’t be able to eliminate and that will obliterate the rock colour. Plus on the sketch you can annotate as much as you want, making your job so much easier later.
Key Takeaways
A sketch from far away is a moment of reflexion. Take this time to really observe the big picture shown to you by the outcrop. And even if this is just a sketch, remember to:
- have a scale
- show the orientation of the face
- annotate all the relevant information
- represent all elements as realistic as possible, keeping the proportions between different layers
It is at this stage that you should select the datum for your cross-section. There are a few considerations to be followed when choosing a stratigraphic datum:
- Generally, the datum is a layer that is continuous across the study area (if possible).
- Usually, it is a thin layer, but if that is not available, than the top or the bottom of a key layer can serve as the datum.
The datum is like a clothesline on which you pin your sections. There are also a few other types of datum, such as the sea level, but for the purpose of this project the stratigraphic datum is the best. The datum is going to be used when you’ll be in the drawing phase of the cross-section. Remember that we said the datum is like a clothesline? Consequently, when drawing it, the datum is going to be represented by a perfectly horizontal line. No correlations can be made across this line.
This panoramic view is an excellent tool. It creates a canvas on which you can draw your action plan. It is the start of the thinking process. From far away you’ll decide on where to place your vertical sections, how many units should you have (usually this number changes once you get closer to the outcrop, but it is a start), what structural elements to pay attention to, etc.
Once all these details are ironed out, you should get closer to the outcrop and together with your team walk the length of your exposed face.
4.2.1.2. Second bite: come closer…
Walking the whole length of the study outcrop has one major purpose, to make sure that you have not missed some important detail when you looked from far away. Basically, you’re trying to be sure that all the locations you chose are not in need of relocation for stratigraphic purposes. For example, a layer might be disappearing and you might want to capture that specific moment. At the same time, remember that the cross-section is going to be a generalized image of the outcrop and consequently it will be impossible to capture every little detail at the scale needed. In order to fit on a piece of paper some details will have to be left out.
Decisions! Yes, it will be a time to make decisions and a lots of them. For example, are layers tapering out? Maybe you’ll want to record that information as it is directly connected to the environment of deposition. Is the outcrop a succession of interbedded laminae of silt-size material and sand-sized material? You might want to consider defining that interbedded sequence as one geological unit instead of trying to describe every individual layer. Is there a unit predominantly sand-sized material but there are some plant-rich clay-sized material lamina present? Again, you might want to consider all that sequence as a unit, but make sure you mention the presence of the lamina.
The process of making decisions is a compulsory part of the field trip as it is going to guide you in your approach of the study of the outcrop!
Key Takeaways
Remember!
- It will be impossible to represent every single detail at the scale of the cross-sections! The details you should insist on are the ones that will be visible on your drawing.
- Yet, make sure you note the other details as well, even if it is just a symbol on the cross-section or in your notebook.
- Decisions, decisions, decisions!
4.2.1.3. Third bite: even closer…
Now that you got closer to the designated section of the outcrop, you have drawn the panoramic view and established the locations of the vertical sections it is about time to start collecting data by looking at each of the individual layers. It is also the time to take all the geological tools out as they are going to be your best friends.
4.2.1.3.1. Uncover
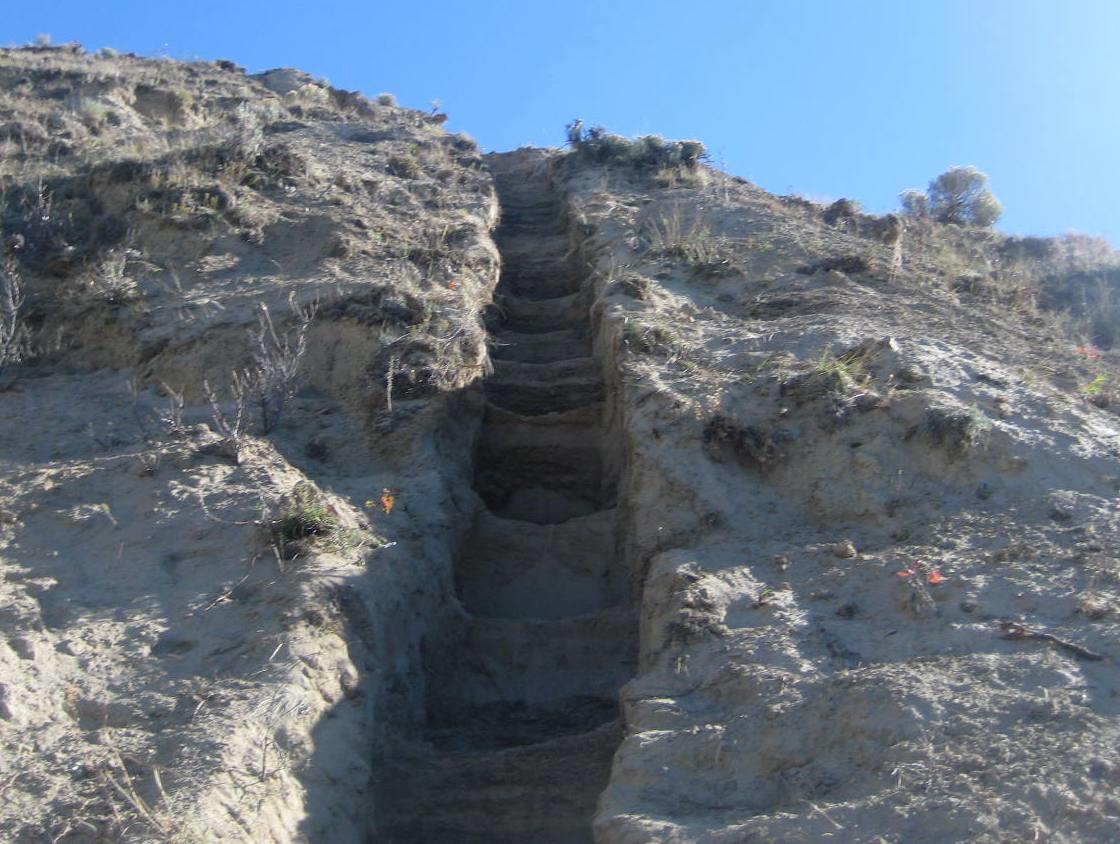
Before you start describing the features, specifically for the unconsolidated sediments, it is recommended to dig a trench or holes at points of interest (Fig. 4.1). Why is that you may ask? In the unconsolidated sediments, such as the ones in the Avonlea Badlands, you’ll have a lot of material sliding down the slopes from above, obliterating the real geological layer. Consequently, take out the shovel, the trowel or any other tool you brought along for this specific job. Digging a little vertical trench or a hole in the waste material allows for a better interpretation of the geological environment. And while you are at it, take out the magnetic compass and measure the inclination of the slope.
4.2.1.3.2. Colour
One of the first things that you’ll notice will be the colour. Simple, right? Well, actually it is not that simple. Every one of us sees colours a little differently. If you want to use colour in a scientific context, Munsell Chart is your best friend. Munsell Chart is an international system to describe colour, so that it doesn’t matter if you describe a colour in North America or in China. Using this notation, anyone with a chart can find out exactly what the colour looks like. For example, if you describe your sediment as having a reddish yellow colour, everyone can imagine their version of reddish yellow. But, if you describe your sediment as 7.5YR 7/8, anyone with a Munsell Chart can find the exact hue of the reddish yellow that you mentioned in your description (Fig. 4.2). One important thing to mention is that the sediments will have different colours when wet as compared to their dry state. Consequently, make sure you describe the colour of the sediment as soon as you exposed it to air and also a little later when it looks dry!
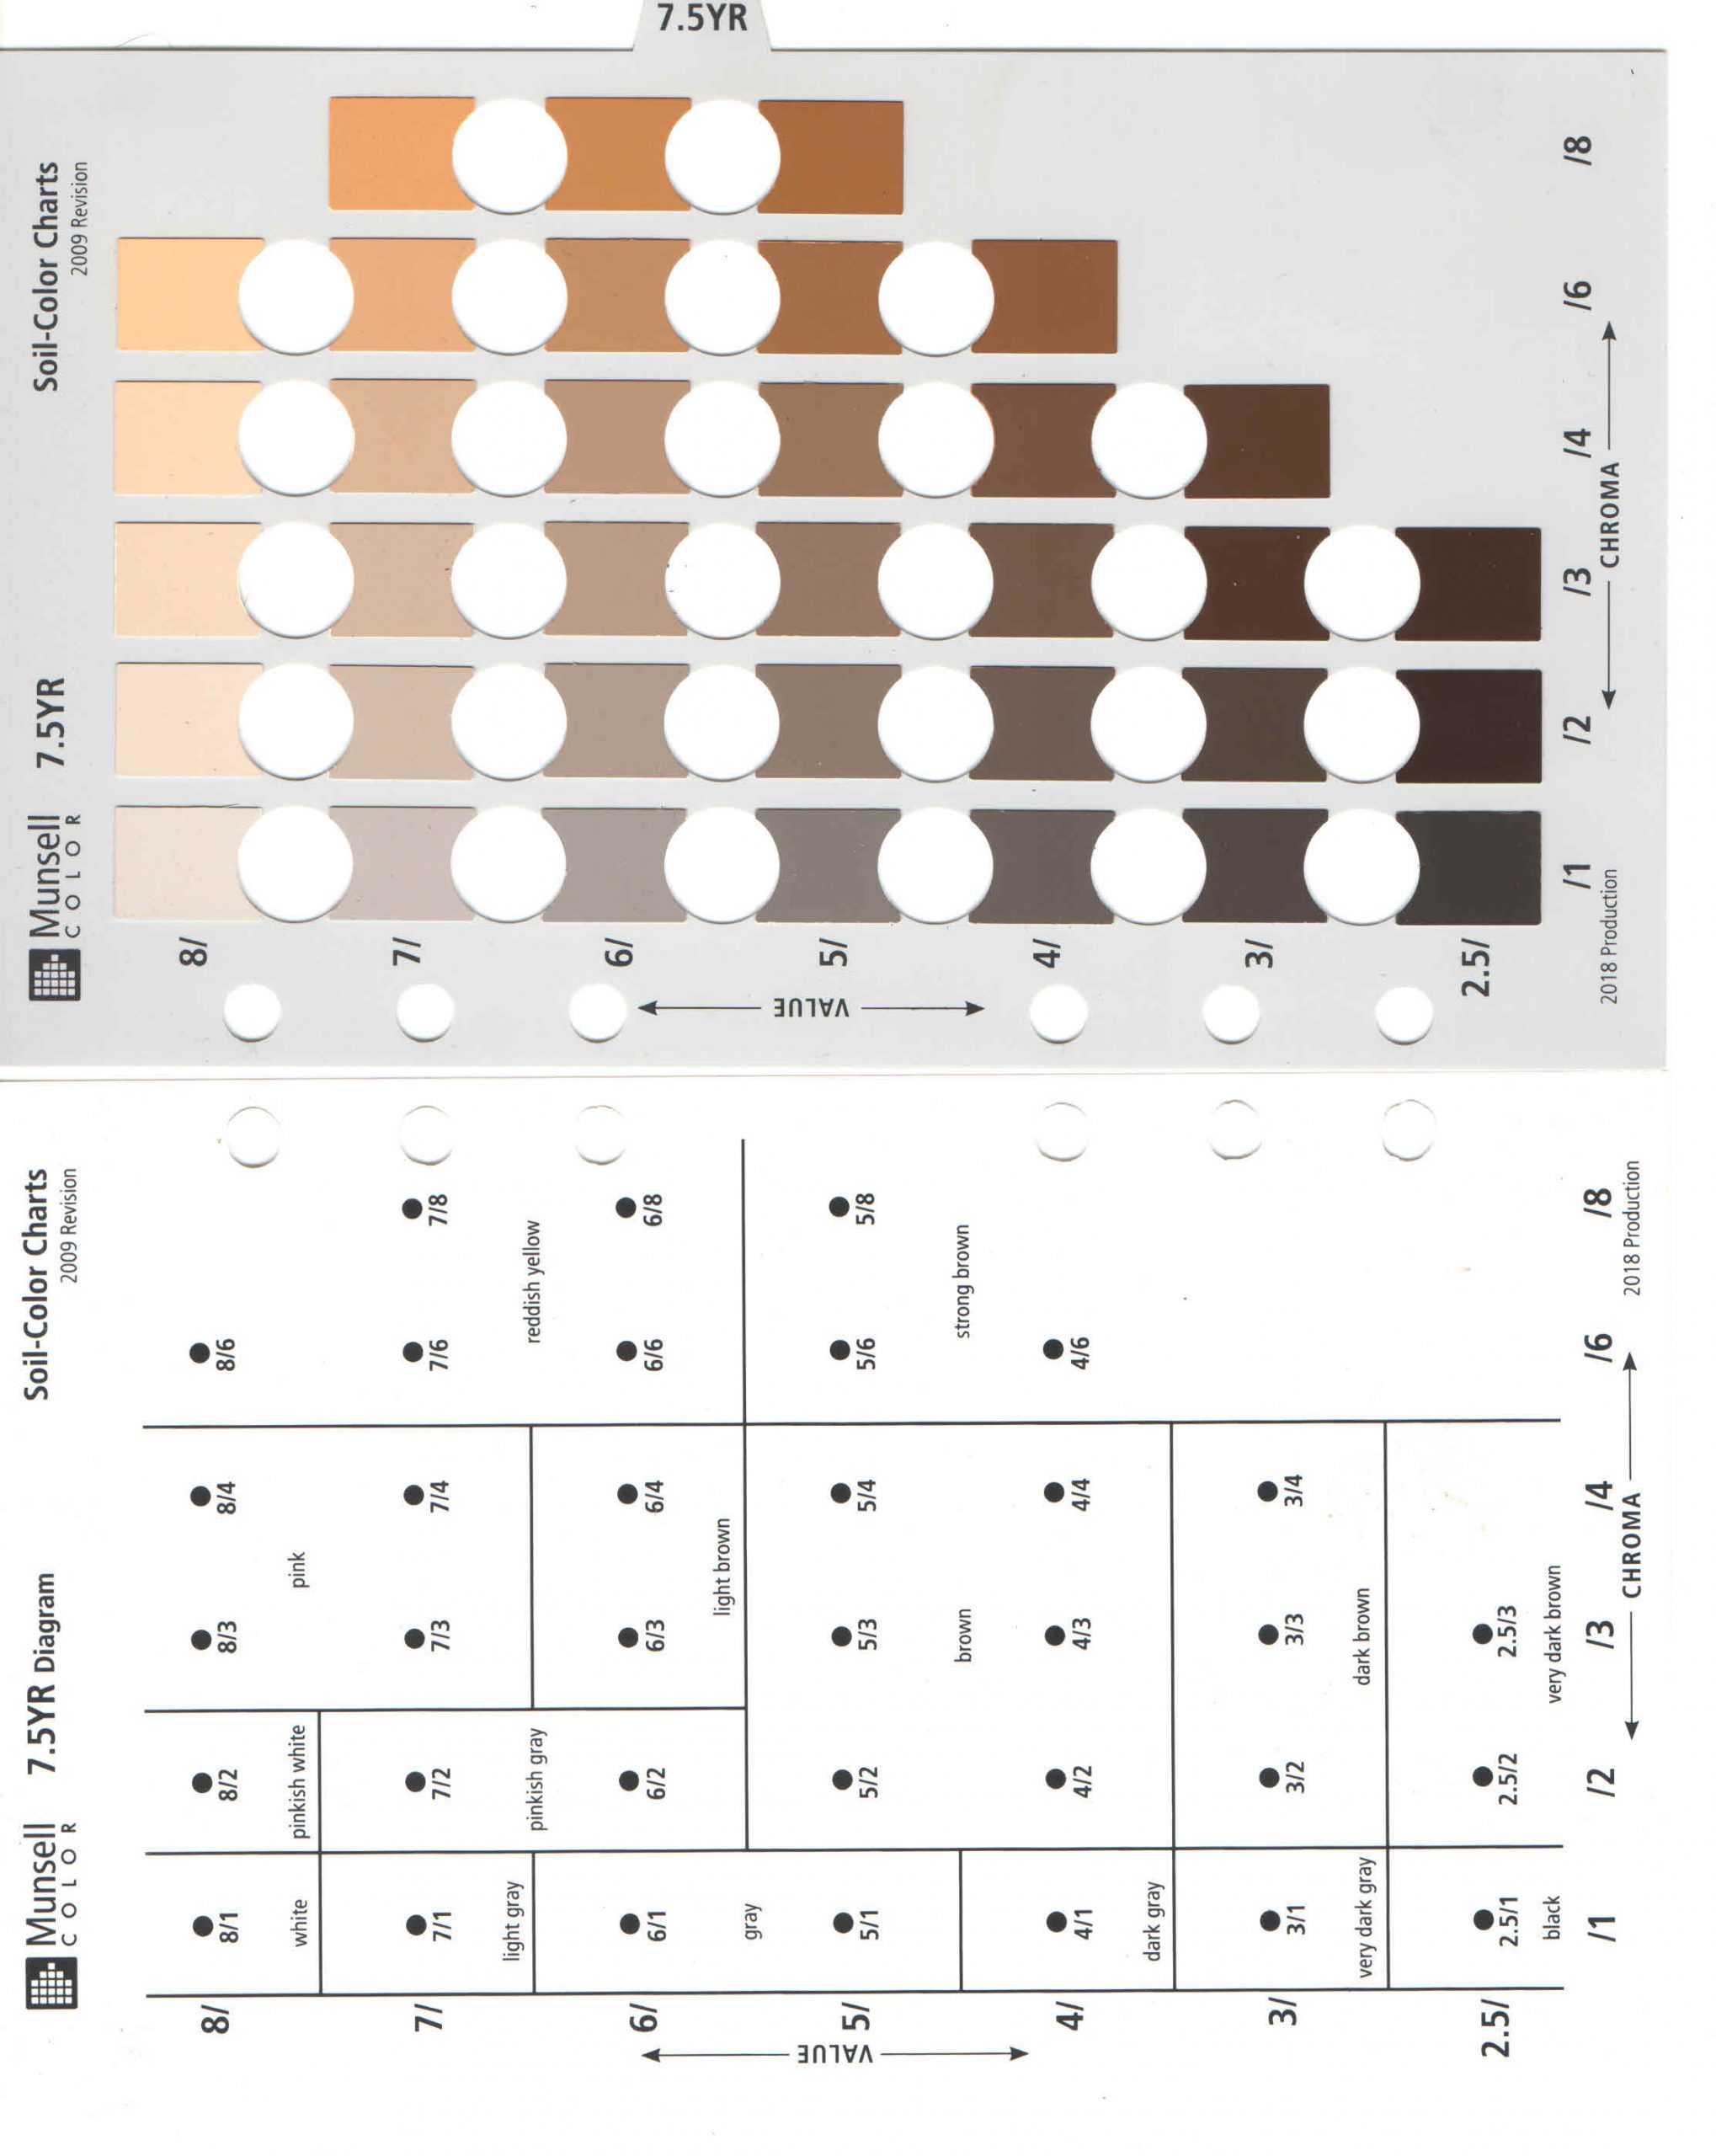
To describe the colour using this system, take a little bit of the sediment and determine the overall colour. Does it look brown, red, yellow, grey, or green? Locate the page or the pages that have the colour the closest to the one you determined. You’ll noticed that the pages with colour strips have some round holes, while the page facing it has numbers and descriptors. DO NOT TAKE THE PAGE OUT! Place the sediment on a relative flat surface such as on a white page, the tip of a camping knife, or on your palm and put it under the page with colour strips aligned with one of those holes. Obviously just above the colour that you think is the closest. Squint your eyes, like when the sun is in your eyes, and while your vision is blurry look and compare the sediment to the colour. If the sediment and the colour strips do not seem to match, repeat the process with a different colour until you find the right one. If the two look the same, than: Success! you determined the right colour.
To determine the scientific term for the colour look at the top of the page and you’ll a number followed by some letters. In Fig. 4.2 at the top of the page it says 7.5YR. The Y stands for yellow while R stands for red, indicating that on this page there are different versions of yellow-red colours.
The next thing to do will be to determine the hue and chroma values. On the page facing the one with colour strips there are numbers vertically and horizontally. On this page, locate the placement of the colour strip you chose and read the values for hue and chroma. Finally, the format of the colour would be along the lines 7.5YR 7/8 and everyone will be able to see exactly the same colour as the one you’ve seen. Pretty neat!
4.2.1.3.3. Size matters
After describing the colour, it is time to take out the hand lens and to assess the size of the material. In this case, it is very useful to have a grain size chart! On a stratigraphic grain size chart as the one in Fig. 4.3 the size of sand is represented in three different modalities. Why only sand? Because anything smaller than sand is too fine to see with the naked eye and anything bigger than the sand you can measure using the centimeter gradation.
Now, let us get back to sands. The first way to classify the sands are based on a relative scale: very fine (vf), fine (f), medium (m), coarse (c), and very coarse (vc). For this classification there is also a lower (L) and an upper (U) limit. The second method is indicating absolute grain sizes in microns. Just a note that 1000 microns are equal to 1 mm. The third method is showing the grain sizes using the Wentworth phi scale. On this scale a value of 0 is equal to 1 mm. Anything coarser than 1 mm will have a negative value. This last method is very useful in doing statistical interpretation of the sands in sedimentological studies. For the purpose of this project using relative descriptors such as fine combined with a grain size in microns would be enough. Initially, it might seem a little overkill to know if the sand material is fine, medium or coarse grained, but this feature is very important when determining the depositional environment, so do not treat it lightly.
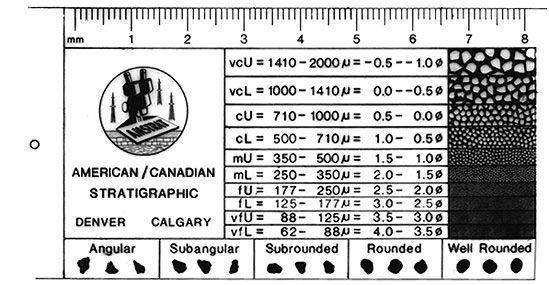
Another aspects to analyze at this point – while you’re having the hand lens – are the sorting, the roundness and the sphericity of the mineral grains. All these aspects are different measures of distance of transport. The farther a grain travels the more rounded and closer to a sphere it will be in association with other grains relatively close in size. If the grain has not travel far it tends to be more angular, less like a sphere and in association with grains of very different sizes. Two relatively end members are beach sand and alluvial deposits. Beach sands are known as being composed of very well sorted, very rounded, spherical quartz grains. Alluvial fans are pretty much at the other end of the spectrum, being composed of very poorly sorted – from clay to gravel and even boulders, very angular, not at all spherical, very divers mineralogical sediments.
4.3.1.3.4. Mineralogical composition
You have already the hand lens so you might as well analyze the mineralogical composition of the material. If it is too fine to determine the minerals, it is probably clay. But in the sands, the distinction between quartz, feldspars and lithic grains should be done! And not only the identification, but also a visual estimation of the percentage of each type of grain is important! For example, a sediment that is made up of more than 90% quartz might indicate a beach or an aeolian depositional environment, while a sediment that is 40% quartz, 40% feldspars and 20% lithics might indicate a fluvial related depositional environment.
This will also be the time to note if there are any types of cements or matrix present in your layer. Is the geological unit consolidated? Then there is some cement present and you should use all the tools to assess which type of cement there is. Does it react with hydrochloric acid? Perfect! You have some calcareous cement present in the rock? Is it brightly coloured in yellowish, reddish or brownish hues? If yes, some type of iron cement is present, out of which the limonitic (yellowish – brownish hues) or the hematitic (reddish-brownish hues) tend to be more common. Doesn’t appear to be any of these? Is the rock strongly cemented and what appears to be the cement cannot be scratched by a steel object? It is most probably made out of quartz and in that case, the rock layer has a siliceous cement. Any combination of these cements it is possible, depending on the local conditions. One thing to remember is that cement is a diagenetic feature. Consequently, it is not relevant for the depositional environment, but rather to what happened to the rock after the deposition happened.
The primary feature that is relevant for the depositional environment is the matrix. A rock that has a lot of matrix is called immature and indicates a depositional environment relatively close to the source of the material. Conversely, a rock that is relative free of matrix indicates a lot of reworking of the material and a longer distance of transport.
One last thing to look for in each layers is the presence of fossils, either plant or animal remains. The fossils are very important as they can provide additional clues regarding the depositional environment. The plant remains, dinosaurs bone fragments or coprolites will indicate a more terrestrial environment, while remains of marine animals such as squids or cephalopods will obviously indicate a marine environment. The fossils clues might not always be this evident. In some cases, only trace fossils will be visible and identifiable.
Now that you looked into detail at the geological unit, you can step back and determine if there are any sedimentary structures present. Is the unit massive with no internal arrangement? Does it preserve cross-bedding? And if so, is it tabular or trough? Are there laminae? And if so, are they wavy, parallel or convolute? Any other marking, such as flute casts? How about flame structures? Being able to identify these sedimentary structures is key, because every one of them is a little clue towards the determination of the environment. There is no single sedimentary structure that could pinpoint unequivocally the environment, but combining the information obtained from the sedimentary structures with every other piece of information collected from the unit allows you in the end to restrict the possibilities. So, pay attention! If the sedimentary structures have a component that can be measured, take the magnetic compass out and measure it. What do I mean by that? For example, if the sedimentary structure is a trough cross-bedding, you can measure the orientation of the bed in the centre of the trough. This measurement, done multiple times in the same area (not on the same structure) will provide you with a dataset that plotted on a Rose diagram can help you infer the orientation of the water flow at that specific point in time. Very handy if you want to interpret the source of the material!
One more thing to determine is the thickness of the layer. Depending on how precise you want to be, there are two methods commonly used. One method is using trigonometry. Applying this method, you’ll need to measure the angle of the slope and the extent of the layer along the slope. Once these two elements are known, you can apply the trigonometric function of
cos (angle)=thickness/length
This methods tends to be very time consuming and in most cases it is not necessary such a level of precision.
The other method is what we call quick-and-dirty method. For this method you’ll need the Jacob’s staff, and two people. One person will sit on the upper contact of the geological unit, while the other person will be located on the lower contact. The person on the lower contact will have the Jacob’s staff and will approximately determine the thickness of the bed by having the eyes at the level….
Having all these pieces of information ready, you can start compiling them in your field notebook! We know it seems like a lot to pay attention to, but if you resist the impulse to go about it randomly, you’ll create a procedure for study that in time will become a second nature. You’ll even stop thinking about it and you’ll just do it.
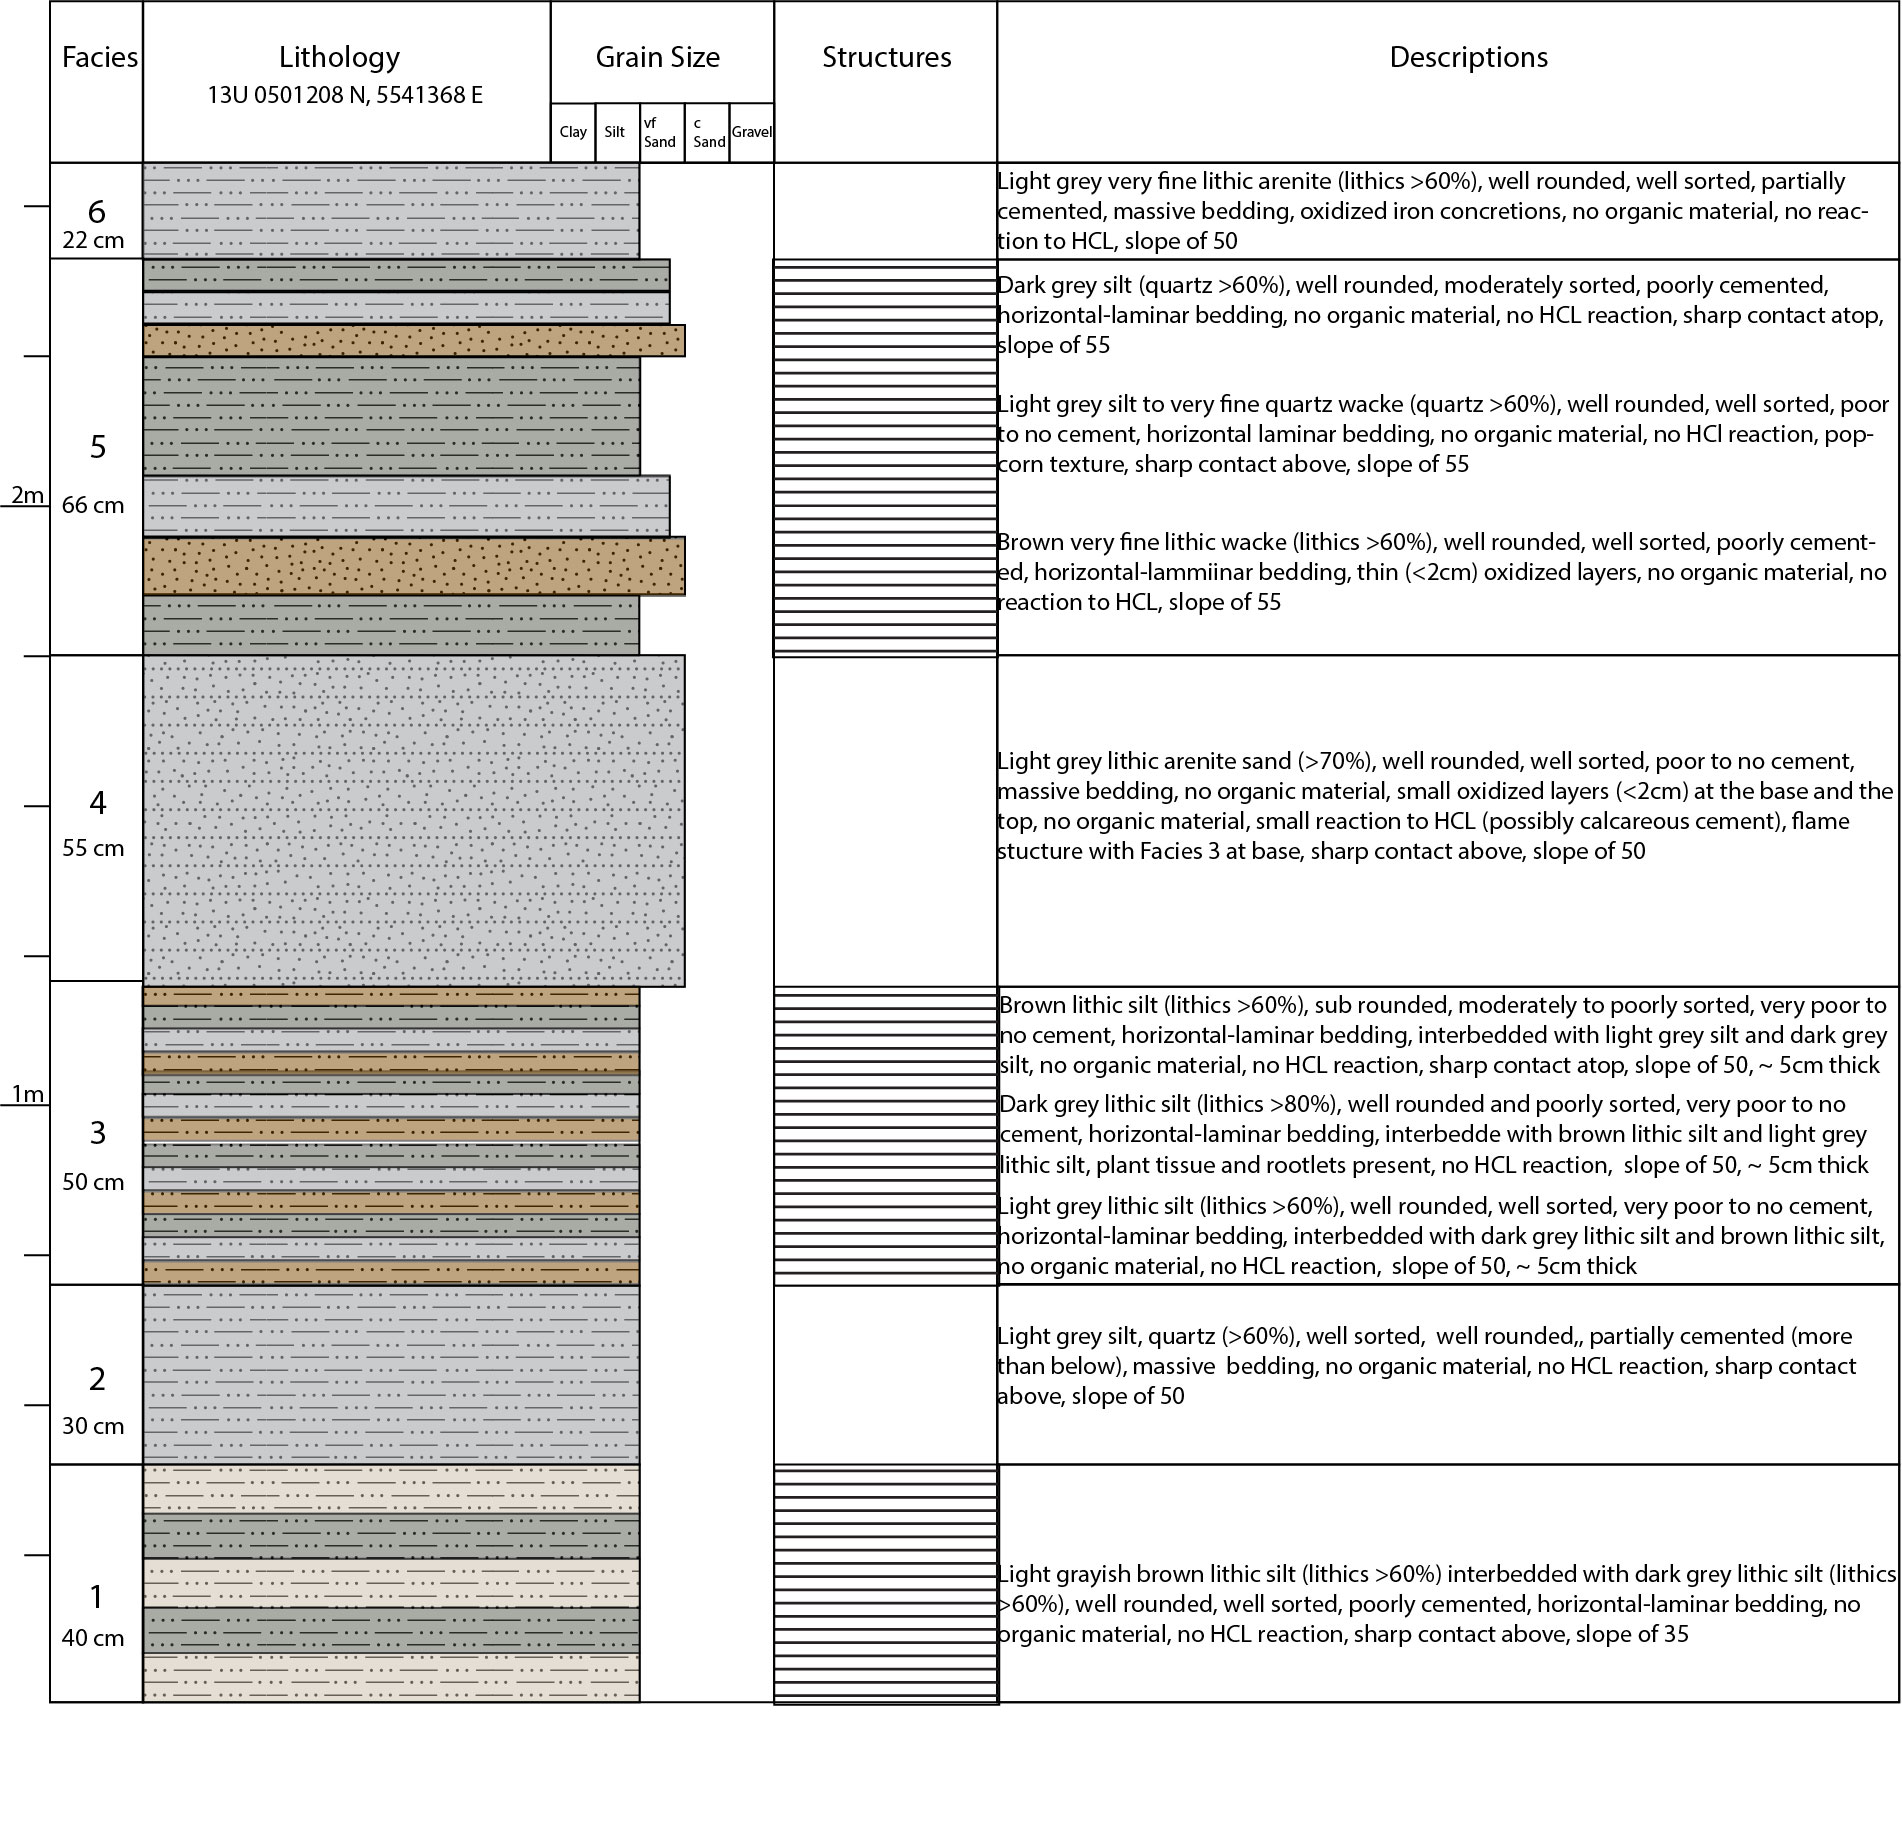
Remember that your notebook should be organized neatly so that it will be easy to follow along! In the end, your data should look something like the litholog in Fig. 4.4.
The geological history of Earth follows the major geological events in Earth's past based on the geological time scale, a system of chronological measurement based on the study of the planet's rock layers.
The Cretaceous is a geological period that lasted from about 145.5 to 65.5 million years ago. It is the third and final period of the Mesozoic Era, as well as the longest. At around 79 million years, it is the longest geological period of the entire Phanerozoic.
The Eastend Formation is a stratigraphical unit of Maastrichtian (Upper Cretaceous) age in the Western Canadian Sedimentary Basin. It takes its name from the town of Eastend, Saskatchewan, and was first described in outcrop around the settlement by L.S. Russell in 1932. The type locality was later defined south-west of the town by W.O. Kupsch in 1956.
Badlands are a type of dry terrain where softer sedimentary rocks, such as unconsolidated sands, silts and clays, and clay-rich soils have been extensively eroded. They are characterized by steep slopes, minimal vegetation, lack of a substantial regolith, and high drainage density.
Related to the deposition of the sediments.
The lithology of a rock unit is a description of its physical characteristics visible at outcrop, in hand or core samples, or with low magnification microscopy. Physical characteristics include colour, texture, grain size, and composition.
A rock formation that is visible on the surface.
A fine layer (~ 1 mm thick) in strata, also called a lamina, common in fine-grained sedimentary rocks such as shale, siltstone and fine sandstone. A sedimentary bed comprises multiple laminations, or laminae.
The Munsell Color System describes a soil’s color, based on Hue, Value & Chroma. The Munsell Chart is a collection of color chips with varying degrees of hue, value & chroma. Take a small soil sample and match it up with the appropriate color chip to determine that soil’s Munsell “code.”
HUES tell you how red the soil is… 2.5YR (2.5 parts yellow to 1 red) is pretty red; 10YR (10 parts yellow to 1 red) is more yellow…
VALUES tell you how dark the soil is; A horizons are darker, with a lower value (2 or 3) due to humus. E horizons are often light colored (5 or 6 value).
CHROMA tells you how bright vs. dull the soil is; a low chroma (2 or less) means the soil is GREY, hence wet or waterlogged; higher chromas mean better drained, more oxidized soil.
The remains or impression of a prehistoric organism preserved in petrified form or as a mold or cast in rock.
A flame structure is a type of soft-sediment deformation that forms in unconsolidated sediments. The weight of an overlying bed forces an underlying bed to push up through the overlying bed, generally when both strata are saturated with water. The resulting pattern (in cross section) may resemble flames.
