Expanding Active Learning
2
Laure Charleux
Keywords
gamification, moodle
Teaching Applied Stats to GIS Students
Geographical Information Science is about collecting data and analyzing them in relation to their location in order to create new information. For instance, GIS students might learn how to integrate data from the park and recreation service of a city with census data to calculate and map the ratio of public green spaces to the number of inhabitants within a certain reach. Quickly though, some amount of basic statistical knowledge is needed to carry out interesting analyses and draw meaningful conclusions. For instance, students need to know about spatial correlation to decide whether or not the poorest areas of the city also tend to be the ones with the least access to public green spaces.
Until recently, academic GIS programs have mainly been at the graduate level but they are trickling down to the undergraduate level at an accelerating pace. While it is standard in many disciplines to expect graduate students to learn how to carry-out statistical analyses, the endeavor is more challenging at the undergraduate level. With GIS especially, many students choose the field because it is a technology-oriented discipline that is perceived as requiring little to no math. As a result, in my “Applied Statistics for GIS” class includes some seniors who are at a loss for calculating percentages. This mandatory class hits them off-guard, as they are required to calculate not only percentages (or other indicators), but also estimates of percentages and their confidence intervals, and to test how significantly they differ from one another or from a reference level. Students are also introduced to bivariate analysis and have to carry out and interpret a couple of regression analyses. Confronted with a higher level of math than expected, some students become defensive.
In truth, I also get students who are really good at math. Some of them are even double majors in another field, like biology, where they have learned some statistics. But they too are disturbed by the applied nature of this class. While they are used to and good at neat exercises where everything works according to the book, this course requires they work with “real world” scenarios. The praxis of GIS data analysis is messy, and it is important to introduce students to this messiness: How does one make the call to exclude outliers from the analysis? How strong does a correlation need to be to be deemed worthy of further exploration? When is it okay to recognize one does not have enough information to draw conclusions and how does one report this? For some of my students who feel comfortable with math as a sequential process of reviewing a problem, selecting a formula and calculating the correct solution become very disturbed when confronted by the murky reality of praxis.
When I first started teaching this class, I used a traditional outline, focusing on a different method every week or every other week, with lecture, exercises and lab assignment for each method. My stated goal was to introduce students to a series of important methods, to get them thinking about uses for these methods, and how to use them. The outcomes obtained with this approach were unsatisfactory on several levels, and I will mention only a few here. For instance, this course layout did not allow for the proper emphasis on the messiness of praxis. When students work on a new method every week, as teachers we don’t want them distracted too much by the weird formatting of real-life data, so we end-up pre-formatting the data for them. In this set up, it becomes questionable whether they would be able to apply a particular method when confronted with unformatted data. Additionally, grading each lab only once was not the proper means to improve their statistical writing. As part of learning to analyse and report on data, it is crucial that students learn to write the interpretation of their statistical results in plain language to be understood by non-specialist audiences. But this requires, like any writing assignment, some back and forth between students and instructor, something not allowed by the weekly labs set up. Most importantly, weekly labs on various methods, based on exercises unrelated to one another, did not allow for information to sink in, for real knowledge to form, and for students to digest feedback on ideas or writing. It gave the class the feel of a superficial sampler and student evaluations almost systematically pointed out that they thought they didn’t learn one thing well in the class, even when they had good grades. Obviously, something needed to change.
The Idea of Gamification Emerges
After three years trying various ways to make the class work in the traditional weekly topic layout, I resolved that the layout itself was problematic. This resulted from a goal that was somewhat misplaced. Instead of wanting to introduce students to a series of statistical methods, putting an emphasis on content delivery, my primary goal should be to introduce them to the praxis of statistical analysis in GIS, putting an emphasis on engaging students in learning-by-doing experiences.
The focus on praxis led to the idea of organizing the course through a workshop/studio approach, using experiential learning to provide a meaningful context to help make things stick, contrary to the “sampler” approach. Instead of chaining unrelated, convenient labs to illustrate pre-selected methods, I decided to create a couple of sustained experiences where students would have to learn and use several statistical methods to tackle real-world problems. The problems would be chosen based on the opportunities they would offer to practice essential statistical methods, making these problems the drivers of the learning experience, not the methods.
A difficulty I could anticipate with a workshop-based course was that students working in groups would set up plans for division and coordination of tasks. Rather than this, I wanted each student to intimately grapple with the whole problem at stake. For an applied statistics class I saw this intimate dimension as vital: I wanted every student to be given the opportunity to experience the messiness of data first hand….
and to exert their creativity to find ways to clean, reshape and adapt data to fit analysis needs, while coming to terms with the fact that this sometimes proves impossible and that some questions cannot be answered due to the lack of proper data. Working closely with the problems, each student would need to address the reality that a number of statistical notions are rather counter-intuitive: How come we’d rather use one-tailed tests, which seem to give a less specific information but actually reduce the estimated risk of error? What is the difference between type I and type II errors and how do problems need to be formulated and results interpreted knowing that the most common tests estimate only the type I error? These are examples of notions that students typically struggle with until they have an “aha” moment, which may only come if each student is intimately engaged in the problems. Another difficulty with group work is that students need to keep pace with each other and, from the heterogeneity I had witnessed in previous years, I thought this would just be too discouraging for some and frustrating for others. I wanted to create a learning environment where the pace of each student would be respected.
I was in the midst of these reflections when serendipity struck and elements of my several lives collided. I had recently (finally) purchased my first smart-phone and my kids had gotten hooked on Candy Crush. I was struggling with them spending hours trying to advance through outrageously and nonsensically difficult levels of the game and getting happily frustrated about it. At the same period, procrastinating from grading fall semester projects, I stumbled on a blog post about using Moodle (the content management system – CMS – used at the University of Minnesota) to implement gamification strategies (http://z.umn.edu/17gz). As the light bulb turned on I saw how I could actually set up my class to harness the power of gamification – like Candy Crush, and make an environment in which my students would be happy to work on difficult and frustrating applied GIS problems.
Indeed, Candy Crush is one example of a “railroad” game, where participants advance from station (level) to station until the end of the line. This is compatible with a workshop approach, which requires that students engage in sustained and authentic activities; it only requires parsing the workshop into elemental stages that constitute the different stations of the game. And this transforms the workshop into an individual experience, where all students are on the same journey but can travel at their own pace. One crucially appealing aspect of the railroad game dynamic is that players get to return to each station again and again until they succeed and journey to the next one. I fancied that it would mean the end of superficial C-level work: students would have to actually learn at a satisfactory level before moving to the next station. Not every student would complete the entire game, but at least everybody would get to learn some things well.
Finally, I loved the idea that gamifying the class would almost naturally displace my position from content expert who dispenses knowledge to “game master” who facilitates and coaches, to move from “sage-on-a-stage” to “mentor-from-the-middle” (see Sweet et al., Teaching Applied Creative Thinking, Stillwater, OK: New Forums Press, 2013). While this game would be much more individualized and constrained than a role-game and while teaching stats is not exactly the same as teaching creative thinking, I envisioned that I would be a facilitator and coach to the players/students and that the game would provide ample opportunities for unstructured interactions so that I could model as a GIS professional and a scholar.
How I Did It
If students are to experience the class as a game, it has to look and feel like a game. The trick is to use the class CMS a little differently, showing students a sophisticated and aesthetically pleasing front end only, with links to the actual assignments, quizzes, etc., hidden backstage. I will show how this was implemented in Moodle 2.8 (later transferred without major issue to 3.0) but I expect that the same principles could be transferred to a different CMS. I think the two critical components needed are, in the first place, a completion tracking system to condition the availability of specific items/activities to students having attempted, failed or passed prerequisite activities and, in the second place, a html item type, whose code can be modified by the instructor (“labels” in Moodle).
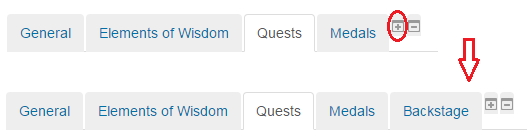
Figure 1: Tabs in the “Onetopic” format of a Moodle course
First of all, content in Moodle can be organized into different sections and I chose to use the “Onetopic” format, which displays one section at a time, using tabs for navigation between sections. This format, displayed in Figure 1, makes it easy to actually hide from students the last sections of a course using +/- buttons.
When the “ + ” button is clicked, the “Backstage” section becomes visible. When the “ – ” button is clicked, it gets hidden again, but all the elements located in this section are still available, if you know their URLs. This backstage section (Figure 2) contains and hides from the students’ direct view all the activities and resources that make up the course.
The core of the game/class are workshops, which I called “Quests”, parsed into several labs, called “levels”. Each quest corresponds to an interactive map in Moodle, as shown in Figure 3.
These backstage activities and resources become accessible to students via hyperlinks embedded in the visible elements of the game.
There are 6 levels in this first quest and this student has already completed successfully levels 1 and 2 (green circles). They have already turned in level 3, but I was not totally satisfied, gave them feedback and a grade less than 100%. Their submission is automatically re-opened and I will be informed when they submit a new version. The appearance of the map will be updated with a green circle around level 3 once they reach 100% for this level.
Technically, these quest levels are “assignments” in Moodle, all hidden from view in the backstage section. As the Figure 3 screenshot shows in the grey highlighted line at the bottom, clicking on level 2 will open assignment #963120. If the student were to click on level 4, they would get a message that particular resource is currently unavailable, as the student had not yet completed level 3.
The image also displays pop-ups when hovering over levels, to indicate whether or not they require a piece of theoretical knowledge to be acquired before unlocking.
There are 6 levels in this first quest and this student has already completed successfully levels 1 and 2 (green circles). They have already turned in level 3, but I was not totally satisfied, gave them feedback and a grade less than 100%. Their submission is automatically re-opened and I will be informed when they submit a new version. The appearance of the map will be updated with a green circle around level 3 once they reach 100% for this level.
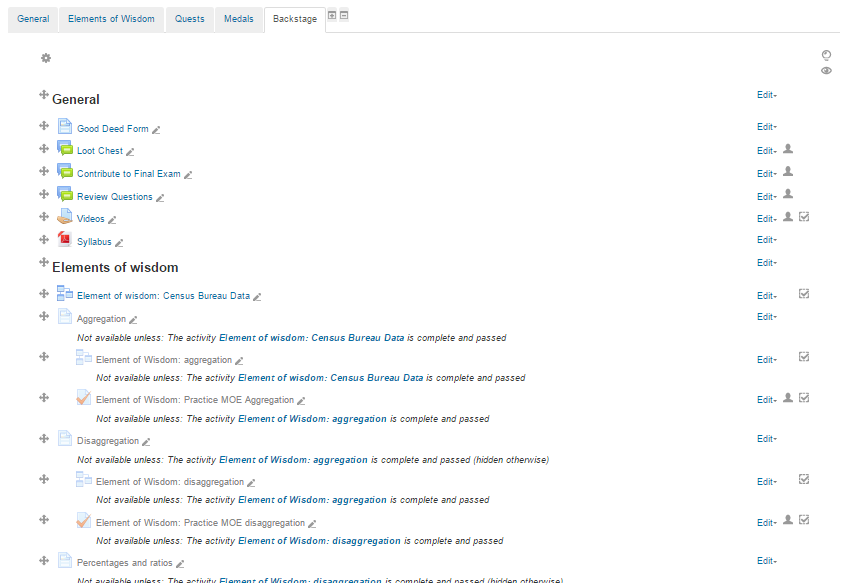
Figure 2: All the activities as resources for the game are gathered in a hidden section of the Moodle course
Technically, these quest levels are “assignments” in Moodle, all hidden from view in the backstage section. As the Figure 3 screenshot shows in the grey highlighted line at the bottom, clicking on level 2 will open assignment #963120. If the student were to click on level 4, they would get a message that particular resource is currently unavailable, as the student had not yet completed level 3.
The image also displays pop-ups when hovering over levels, to indicate whether or not they require a piece of theoretical knowledge to be acquired before unlocking.
Behind the scenes, the Figure 3 map is in fact made-up of several “label” elements in Moodle. Figure 4 displays how I see things as an instructor.
The map is in fact made up of six banners, one for each level, and each banner is repeated in 3 different labels, the only difference being no circle, or a red or green circle around the level. Which labels are visible is controlled by the “activity completion tracking” features of Moodle, with parameters available in the settings for each label.
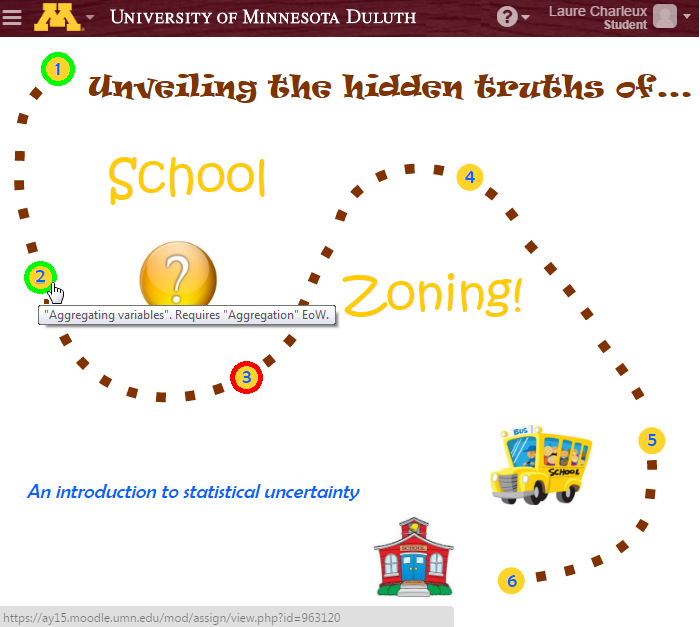
Figure 3: The first “quest map” in Moodle
Figure 5 displays the setting page for the “failed” level 1 label.
First of all, under the “general” tab, the html view was toggled by clicking on the “<>” symbol. Each label is in fact a svg (scalable vector graphics format) drawing, initially created in Inkscape. The code is then simply copy-pasted in Moodle, after toggling the html mode. Highlighted in yellow are the lines of code that set up the link to the assignment and the pop-up message.
The “restrict access” tab shows that the assignment called “Quest stage 1: putting data together” must be completed with a fail grade for the label to be accessed/visible. The struck out eye icon on the left indicates that the label is totally hidden when not accessible.
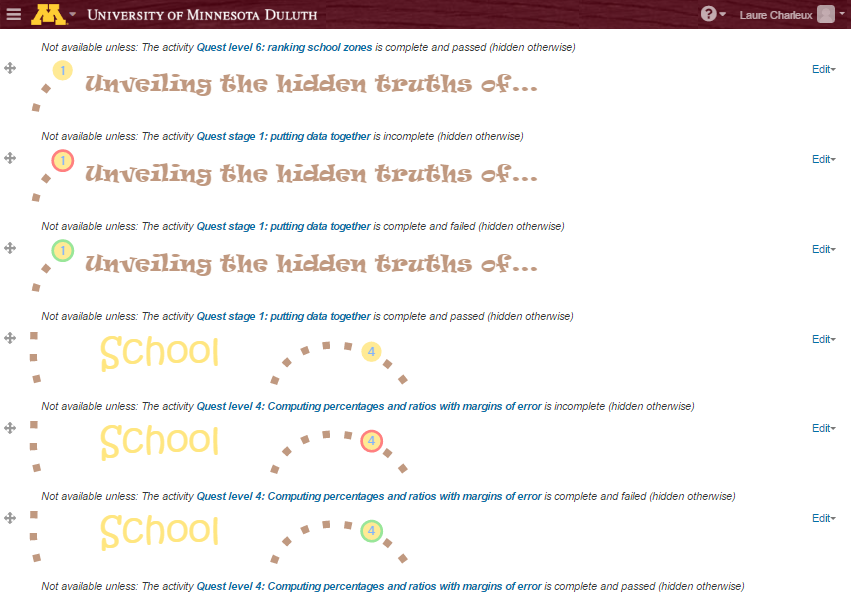
Figure 4: Instructor view of the first “quest map” in Moodle
Elements of wisdom are the second most important piece of the game/class. Most quest levels require some new knowledge to be acquired before being unlocked. This is kept to a minimum though, the focus being on learning through actually practicing analyses. Most elements of wisdom are “lesson” activities in Moodle. Lessons allow chaining content and questions, in order to check that basic concepts are understood before letting students move to more advanced notions. But “calculated questions” are not available in Moodle “lessons”, which is why I had to combine a “lesson” and a “quiz” for some elements of wisdom.
While I always write at least some contextual information myself, many lessons rely extensively on content from the internet. The idea is to introduce students to various sources of knowledge they will be able to draw from after the class is over, when they need to investigate a new statistical method for instance.
Visually, elements of wisdom are displayed using the same principles as for quest maps, with “labels” indicating whether or not each element of wisdom has been attempted yet, or has been attempted but failed or has been attempted and passed. As with quest level assignments, each label links to the corresponding lesson or lesson/quiz combo, which are located in the hidden backstage section.
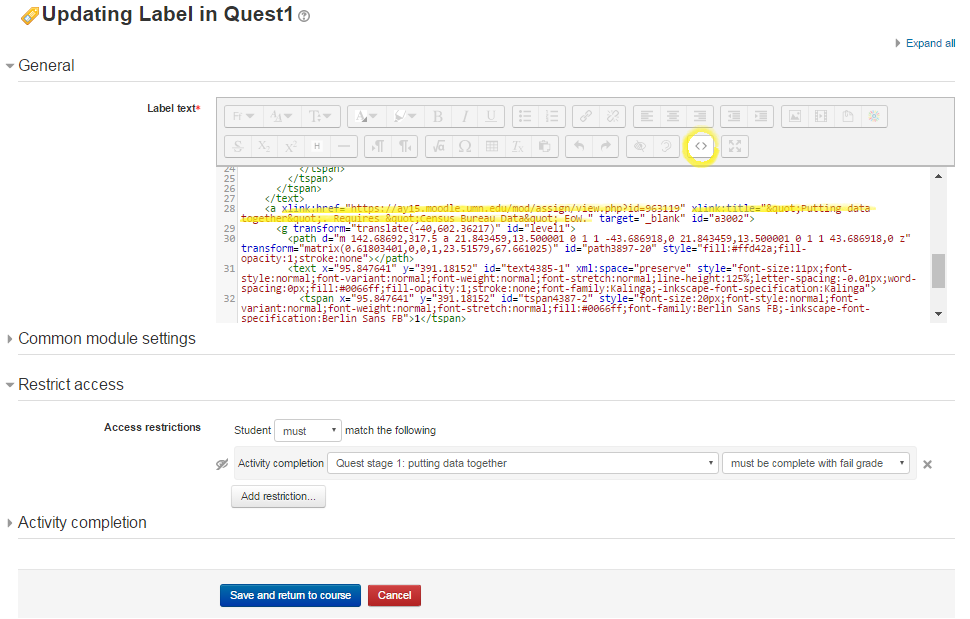
Figure 5: Settings of a “quest map” label in Moodle
Students start the game with a grade of 0 and each activity they complete earn them points. A total of 100 points are possible. Quest levels count for 50 points, elements of wisdom for 30 and the final exam (“Nirvana”, the end of the cycle of quests and elements of wisdom) for 10. To earn more than 90 points and get an A, or to make up for deficiencies, students have to go one step further and earn up to 10 points in “medals”. Medals, like scouting badges, can be earned on various occasions scattered throughout the game. One major way is to help other students: there is a “good deeds repository”, handled through a Google form where students record how much time another student just spent to help them. Some quest levels include an extra task for a medal. Medals can also be earned for posting useful resources on a forum (“loot chest”), for proposing good questions for the final exam, and for anything relevant that occurs or is suggested during the course of the class.
What I learned
The first important lesson I learned from gamifying this class is that, as hoped for, gamification does work as a grit-enhancer and provides students with feedback – and support – as they move through and beyond frustration. I call this the “yeah-factor” effect.
Picture a student who just read about a statistical test and the formula to apply who is then asked to turn in a short application exercise. They are not too sure they understood the reading properly but they don’t want to bother too much for a simple exercise and just turn in something they think might work. The instructor grades the exercise: the student did not get it right; they got a poor grade. The student still doesn’t know how to apply the formula, and likely doesn’t like the instructor very much. Now picture a player who just read about a statistical test and the formula to apply who is then asked to play a short application game. They enter their answer. They did not get it right, the computer asks them to try again, with new numbers. Since they have to get it right to advance, they go back to the reading to figure out what they did not understand, or ask help from a peer, try it again and this time it works. They feel great. Or, perhaps, after reading and trying time and time again, they cannot get it right; however, rather than just being frustrated, they ask the game master for help at the next class session. With an encouraging game master, the students are willing to show how they are doing it. The game master offers feedback on their effort and drops a clue. Their eyes brighten, they utter a thank you. As the game master walks away to help another player, she hears a loud and radiant “Yeah!”.
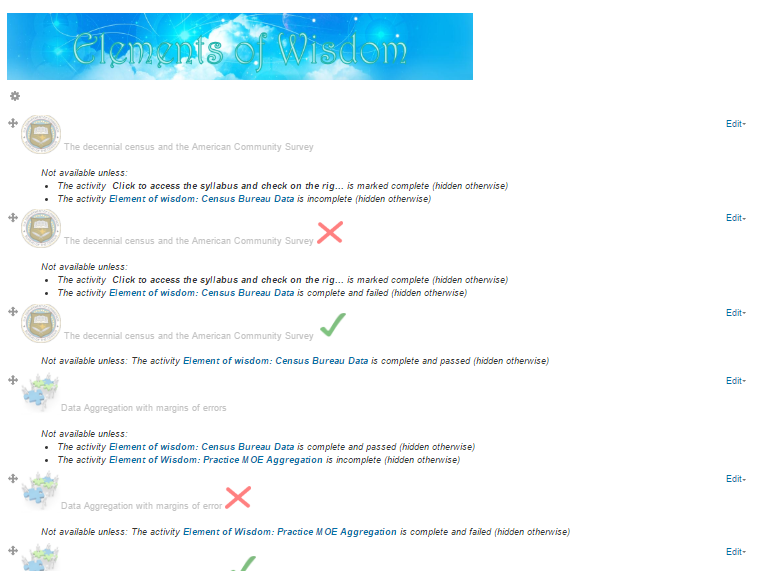
Figure 6: Instructor view of the “elements of wisdom” in Moodle
Not only does the game help everybody feel good through and beyond frustration, there are additional learning benefits. Repeating application exercises helps notions sink in more deeply. Going back and improving analyses based on mentor feedback until they are of professional quality develops the sense of the craft that is data analysis, of the respect owed to the final audience and of the value of a work well done in general.
This might be the most important lesson I learned about teaching a gamified class, somewhat unexpectedly: group dynamics matter a lot, even though the game is played individually.Looking at outcomes more formally, there is a clear trade-off between breadth and depth, between the non-gamified and the gamified version of the class. Fewer statistical methods were covered in the gamified version, but students performed better on the final exam, even though more advanced questions were introduced. The reduction in breadth is even greater if one takes into consideration that not all students complete the game. Feedback from students made it clear that it was easy to slack off without deadlines for the completion of each level. The second time I taught the gamified version, I introduced indicative dates at which each level should be completed if students wanted to stay on track to complete the game, and completion rates improved a little (⅓ of students completed 90% of the game the first year, 3|5 the second year; ⅔ completed 70% of the game the first year, 4|5 the second year).
From the instructor’s perspective, teaching a gamified class is different on many levels. First of all, the entire game must be set up before the class starts. Whatever the content management system used, there is a fair amount of tedious work to control which image is displayed and which activities are unlocked after each activity is completed. One could theoretically get away with setting up the shell only before the class starts, and writing the labs and lessons just ahead of the first player. But this means taking a chance on something not working out well at the end. This initial effort is rewarded by a much more relaxed semester, where the traditional hassle of grading is replaced by organic feedback to students. At the end of the day, students will all get to 100% on each quest level in order to advance to the next one. This removes the hassle of coming up with a “fair” grading scheme that works for all. Instead, the instructor can really focus on identifying elements worth improving in the work of each student without restraint to preselected dimensions, as it would be the case in a “real” professional situation. My single preferred thing with this system is that I don’t get stacks of labs to grade all at the same time: after a while, quest level submissions and resubmissions trickle-in rather constantly and I can spend half an hour every morning giving real time feedback to students, rather than cramming half a day of grading every week. In addition to this written feedback on quest level submissions, class time is typically unstructured, spent mostly on mentoring. Mentoring is partially individual, helping students one at a time, but there are a lot of opportunities for sharing as well: sharing individual questions that are of interest for everybody, sharing the experience of players that are further ahead in the game or sharing one’s own experiences related to the methods or the topics studied. The time spent telling those “stories” did feel slightly digressive at the time but, looking back, many student evaluations spontaneously mentioned them as one of their main source of learning in the class, maybe not directly and tightly related to statistics, but on what it means to be a GIS professional in general. Opportunities for sharing do not arise automatically though; a lot depends on the group dynamic.
This might be the most important lesson I learned about teaching a gamified class, somewhat unexpectedly: group dynamics matter a lot, even though the game is played individually. I have taught the gamified version of the class twice. The first time 15 students took the class, almost all were GIS majors, almost all had several friends in the class and almost all had already taken two or more of my classes. By contrast, I knew only half of the 12 students who took the class the following year, only half of them were GIS majors and most of them knew nobody or just one person in the class. Adding to that, because of some renovation taking place, the working lab reserved for students who take GIS classes to do their homework was not available the second year. Students had reserved workstations in the library, but it was in a silent space, making collaboration difficult. On top of everything, I caught a bad virus at the beginning of the semester and was not my usual self for nearly two months. As a result of all these circumstances, group cohesiveness never built up. A first symptom was that students hardly helped one another, whereas they had appeared to be constantly helping each other the first year. The ramifications were multiple. First of all, they obviously didn’t benefit from the documented advantages of peer-tutoring. Then, since they were not helping each other, they had to wait for me to help them when they got stuck, leading to frustrating down time. This significantly reduced their gratefulness for the help and the “yeah-factor” effect. Also, this mechanically implied that I had to spend more time providing individual support rather than sharing things with the entire group, which in turn didn’t help group comfort and cohesiveness. All this didn’t have direct damageable effects on the immediate measured outcomes: the final exam results were similar to the previous year and the completion rates were up (due to new indicative deadlines). But this led to a less enjoyable experience for everyone, less side-line learning and a sense of lesser accomplishment – as attested by student evaluations that were a lot less enthusiastic than the previous year (though still better than with the non-gamified version).
This lack of group dynamic took me by surprise. I was unprepared and kidded myself for too long that it would eventually all fall together. Looking back, I have identified the factors why it didn’t work out (see above), and I will have a panoply of community building activities and devices at the ready next year, to be used if similar difficulties arise again. I will also work with students to help identify times in their schedules where they could meet and work together outside of class time, not in the library but in a collaboration-friendly space. I think it is ultimately the instructor/game master’s responsibility to build the group cohesiveness, because the spirit of the game is at stake. At the end of the day, gamification is just an illusion, literally a mind-trick that generates dopamine secretion to help students through challenging concepts and tasks. Collective buy-in strengthens the illusion, so that when somebody starts wondering whether the emperor has clothes, everybody else reinforces that he does. If the illusion starts to unravel, then the entire game setup becomes a series of cumbersome convolutions, which probably raises the stress level rather than helps, and fuels resentment.
Because gamification ultimately relies on the students’ willingness to be tricked, my final piece of advice is that it should be used with parsimony. I expect that if students were in several gamified classes, their enthusiasm would falter and they would be less willing to “play the game”, or require even more sophisticated setups. Until studies showing otherwise are available, I will personally reserve gamification for these extra-challenging classes where students most need a grit boost.
