Reframing Assessment
11
Xavier Prat-Resina, Molly Dingel and Robert Dunbar
Keywords
learning data analysis, curriculum development
Environment that Inspired Tool Development
The University of Minnesota Rochester (UMR) opened its doors to students for a Bachelor of Health Sciences (BSHS) degree program in fall 2009 with the mission of utilizing evidence based teaching strategies and providing a personalized learning environment for students. This mission was supported by a requirement that the UMR tenure track faculty conduct research in the area of teaching and learning, and an institutional commitment to generating a large database of student data that could be used for that faculty research. Initially, the database was envisioned to be one part of a larger system named iSEAL (intelligent System for Education, Assessment, and Learning) (Neuhauser, 2012) which would serve as a “curriculum delivery and research tool” (iSEAL Design Documentation, 2010) in the place of Moodle, Blackboard, or similar Learning Management Systems (LMS). However, more than just an LMS, the goals for iSEAL were to store data and assess student progress (Neuhauser, Mondal, & Lin, 2009, slide 7). In practice, iSEAL was storing a lot of data about student performance, but accessing that data was challenging.
In early 2013, faculty took the initiative to try to build a tool that would allow us to share, visualize and start understanding the student data that we were accumulating. A typical challenge when implementing learning analytics at the department or curriculum level is that those interested in answering the learning research questions (usually researchers) are not necessarily the same people who deliver the courses (faculty). Also, these faculty and/or researchers are seldom involved in developing the source code for data representation, storage, and analysis. We believe that at UMR we were in a privileged situation where the three groups of people described above were either the same group of people or at least could work very closely.
Our primary goal was to bring together an interdisciplinary group of faculty to identify a set of relevant research questions, indicators, and databases in order to develop and test a tool that would allow faculty to connect learning analytics with course design. We proposed that developing an effective and easy to use learning analytics tool that allows faculty to intelligently and dynamically explore the large amount of student and course data would increase the probability of faculty adoption. This Browser of Student and Course Objects (BoSCO) would help faculty connect course design and learning outcomes at both the course and curricular level and, therefore, increase both the efficiency and effectiveness of course and curriculum design (Dunbar, Dingel, & Prat-Resina, 2014).
Development of Tool with Focus on Faculty Research
Our project, funded by the University of Minnesota Provost’s Undergraduate Digital Technology Grant, began with a focus group in which the entire research faculty at the University of Minnesota Rochester met to identify types of data they would like to collect related to their areas of research. Specifically, UMR’s ten tenure-track faculty met on 19 June 2013 for 4 hours. During the meeting, each completed a survey about types of data they would be interested in, noted where that data was located, completed a survey about characteristics of a successful curriculum, and participated in a mediated discussion about their responses on each survey item. Following an analysis of the data collected from the surveys as well as the subsequent discussion, it was discovered that our faculty wanted data in five priority areas (listed from highest to lowest): Information about student development and attitudes, course content and curriculum, metrics of performance, demographic information, and postgraduate information.
Collecting, storing, and visualizing the types of data prioritized by our faculty involved significant challenges that could be grouped into three broad categories: Primary among these, variability in faculty data priorities meant that all data needed to be accessible through multiple databases or collected into a single database. Second, the faculty needed a convenient way to explore the database(s). Third, the data explored by faculty needed to be secure and managed according to our group’s existing IRB protocols. Given that our group already had active IRB protocols, we focused our tool development on collecting and visualizing data relevant to our faculty. Once we understood faculty data needs, an evaluation of the characteristics of existing resources ultimately resulted in the separation of the iSEAL database from the iSEAL LMS functions and construction of software (BoSCO) that allowed faculty to explore the iSEAL database.
Development of BoSCO
The iSEAL “all in one” model was a necessary step in realizing that we were trying to carry out too many distinct projects simultaneously. There were at least three different products in one: developing a competent LMS from scratch; building a database to consolidate longitudinal student and course data; and designing a learning analytics tool for faculty research. The obvious limitations in budget and the fact that the three products required very different technologies made it clear that we needed split the project into three separate segments, and to outsource as much development as possible so that we could focus on the learning analytics research.
This change of direction in the project was motivated by time and budget considerations, but was also a natural step that loosely fits the model-view-controller (MVC) software architectural pattern. In the MVC model different representations of information are separated into different interconnected parts. These three connected parts or levels could be labeled as “data collection”, “data storage” and “data representation” as they represented in figure 1. Below we describe in detail the characteristics of each of these three levels.
Level 1. Data collection:
The LMS market is very dynamic as it tries to adapt to new technologies emerging every year in higher education. The University of Minnesota officially adopts a LMS to support system-wide, and employs a team of developers to maintain a working LMS for all students in all of the UMN campuses. (In 2017-2018, the University will switch from Moodle to Canvas as the system-supported LMS.) It became obvious that UMR had no resources to compete with, or even match, this expensive and fast development type of project. Therefore, it was appropriate to take advantage of the resources that the University of Minnesota system offered to our campus. By doing so, we could outsource the LMS development by relying on the system-supported, and invest time in connecting the external LMS with student data. In addition, outsourcing the LMS also gives the necessary academic freedom to faculty to choose any software that they see fit to deliver the pedagogical experience they consider most appropriate.
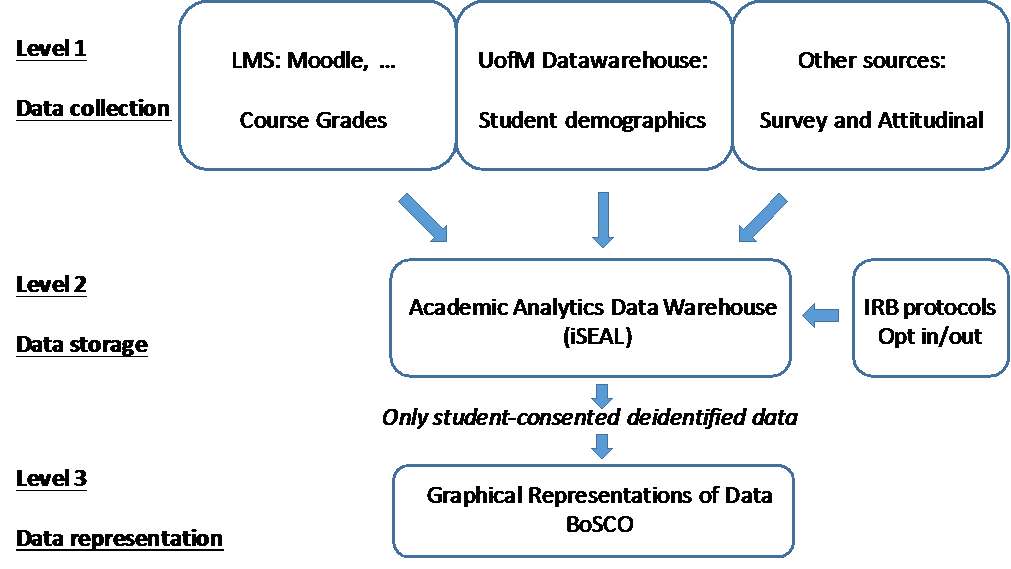
Figure 1: A general scheme of the project divides it in three interconnected levels, data collection, data storage, and data representation.
Thanks to the collaboration with the University of Minnesota Moodle team, our own web development team built an interface to query Moodle’s API (Application Programmer’s Interface) and, at the end of each semester, import the student grades from Moodle. In principle, this same strategy could be implemented with any other LMS that our faculty would choose.
As seen in Figure 1, demographic data usually resides in the data warehouse used by admissions and the student development teams across the university system. Data such as ethnicity, sex, age, high school background and other demographic indicators are typical fields in the dataset, which we imported into our local database.
Finally, there is another source of data that must be imported into our database from the “data collection” level (see Figure 1). Surveys and attitudinal student data may reside outside of the LMS because they are administered by other software (Qualtrics, Act engage, Google Forms, SurveyMonkey, MS Excel…), the survey is given in paper, or is given to a group of students that are not linked to a specific course. Survey data could also be gathered from a whole cohort, alumni or any other subgroup of students. It was, therefore, necessary to be able to import other kinds of data into our system.
Importing student, demographics and survey data along with IRB consent tracking constitutes the main content of our local database that we labeled as the “Academic Analytics Data Warehouse” (AADW) described in the next paragraph.
Level 2. Data storage:
The essential design of the Academic Analytics Data Warehouse was already in place several years ago when iSEAL was the LMS of choice. It is important to point out that the structure of the AADW could not be similar to a regular database of a LMS. That is, in a regular LMS the same course offered in different years or different instructors become two unrelated instances in the database. In fact, the Moodle software at the UMN system changes the entire database each academic year as new Moodle versions get upgraded. Our AADW could not change every year; it had to remain the same database to preserve the longitudinal picture. Each offering of a course in our campus had to be related to the course delivered in previous years. By doing so, each semester would add another layer of courses in the pre-existing scaffold of the BSHS curriculum.
In addition, as part of its initial development, iSEAL’s web interface houses a copy of the IRB protocols, and offers students the option to opt in or out of the research study at any point during the semester. Each semester the system keeps track of the students that have given their consent to be part of the study.
Even though a lot of work and good ideas had been implemented in the original iSEAL, a new database had to be created, the AADW. We needed the flexibility to import the different types external data listed in the “data collection” section, as well as to connect the learning and course objects with summative and formative assessment. In other words, in the initial iSEAL, the course activities and the student grades associated to those activities were not linked, and that had to be corrected.
Level 3. Data representation:
A key component of this whole endeavour is finding an answer to the question “How should we make data available to faculty?” First and foremost, it is fundamental that FERPA, the IRB protocol, and faculty data ownership are respected throughout the whole process.
As figure 2 schematically shows, there are currently two types of access to the data, a manual download/upload and an automatic querying through Tableau visualization software (www.tableau.com). These two types of access to the data are used in the two different versions of BoSCO and they serve different purposes.
BoSCO beta version: The manual download/upload via BoSCO was the first strategy developed, which is described elsewhere (Dunbar, Dingel, and Prat-Resina, 2014). BoSCO beta is kept available and under development as it currently works as a beta version for testing new ways to represent data. One of the advantages of this more manual process is that an instructor can add additional data that currently does not reside in the AADW database. To that end, we have made available a “deidentifier” tool: faculty can upload an identified external grades file and the tool can substitute students’ identity with an unidentifiable code. The returning deidentified file also lists whether or not the students gave their consent to participate in the research protocol during that semester.
The download option is also used when faculty want the deidentified data to be used for further analysis in other statistical software. For example, as the download format is one csv file for each course it makes it straightforward to upload data in the R statistical package.
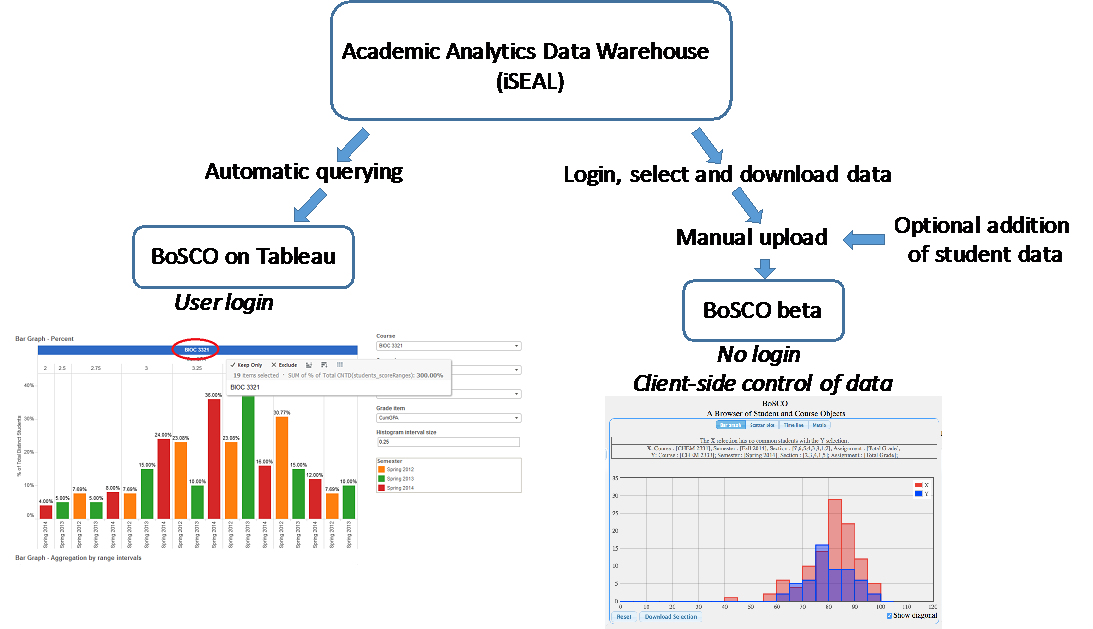
Figure 2: The two different strategies for data representation, “BoSCO on Tableau” and “BoSCO beta” have similar graphs but serve different purposes.
One last advantage of this version of BoSCO is that since it is the user that uploads the data to the BoSCO beta interface there is no problem of data ownership because it never connects directly to the database, the user can erase the visualized data at any time.
BoSCO on Tableau: The second way to visualize the AADW data, and the second version of BoSCO, is through Tableau, which is a more robust, stable interface and ready for mass consumption. Tableau directly queries AADW and, upon login, makes available to the user only the data to which they have ownership or access. Because different faculty own different types of data, one needs to build in Tableau a “viewer page” for each faculty member or each data owner.
The two versions of BoSCO presented here serve two different purposes. Although licensing costs may make the Tableau interface less attractive, it is important for a development project like ours to keep a more stable and robust product, like the BoSCO on Tableau, separate from the more under development, internal use and testing “sandbox” software like the BoSCO beta version.
Both versions of BoSCO shown in figure 2 have very similar types of graphical representations. Upon the selection of one or several courses, semesters and/or assignments, the user can represent the data using bar graphs and xy-scatter plots. In all cases, the selected data can be filtered by demographics indicators (sex, race, etc.) or by performance in other assignments such as ACT scores (See Dunbar, Dingel, and Prat-Resina, 2014 for a further description on types of representations).
Even though BoSCO will provide a summary of basic statistical information about the selected student data (like means and standard deviation), as we have previously stated, BoSCO is not a statistical tool and contains no algorithms for learning analytics. Rather, it tries to represent in a simple and intuitive way the large amount of student data our institution accumulates through the years.
Project Outcome
Hypothesis Catalyst:
This project has led to the creation of a tool that is at its core a way for faculty researchers to quickly explore large amounts of student and course related data. The tool that emerged does basic statistics and correlations but comprehensive analysis is necessarily dependent on the specific research questions of each faculty member. In the world of academic analytics, therefore BoSCO serves a distinctive but very useful role as a “hypothesis catalyst.” Using BoSCO, our faculty are finally able to navigate and visualize large amounts of data of various types. While this exploration does not provide a direct measure of learning, it can help formulate meaningful questions based on the landscape of student and course data. In this way, BoSCO is not dissimilar from a telescope that does not provide a direct explanation of how the craters of the moon are formed, but does let us know they are there.
What follows is a specific example of how BoSCO has worked as hypothesis catalyst in our courses. For example, in one of UMR’s Chemistry courses, we offer students homework quizzes with several attempts. Students had often complained about the homework not preparing them well for the exam. Using BoSCO we were able to see that, in fact, the homework scores did not correlate with exam grades or final grades. All students obtained pretty high grades in quizzes but not necessarily in exams. However, BoSCO also showed us that the quiz score on the first attempt did correlate with exam grades. Students who performed poorly in the course would require more quiz attempts to achieve the same score as high course performing students. This phenomenon would give a false sense of understanding and accomplishment to low performing students. Therefore, we used BoSCO to hypothesize that if we decrease the number of possible attempts in quizzes in the forthcoming semester, the homework grade would better inform students, and make them aware of their realistic understanding of the subject.
BoSCO has also been used to compare student’s grades across different courses in our curriculum, allowing us to see how students’ demographics, attitudes, or aptitudes correlate with performance in different subjects and over time. While the exploration of data at this level has not specifically led to the generation of any hypothesis or change in the curriculum, it has provided an opening for us to begin to think about changes we might want to make (and investigate) to support student success.
Overview
In this paper, we described the development of a learning analytics tool that may help faculty interested in visualizing and understanding the basics of course and curriculum student data. In our description, we paid special attention to the different stakeholders involved in the development, the types of data and their storage, as well as the necessary IRB protocols and data deidentifcation that must prevail at all times. For institutions interested in using our BoSCO approach, we made available the source code of the BoSCO’s version referred above as “beta version.” It is free to download on the GitHub software manager at https://github.com/xavierprat/BoSCO and can be installed on any modern web server. At this URL there is also a video tutorial regarding how to use BoSCO and the type and format of student data that it requires.
References
Dunbar, R. L., Dingel, M. J., & Prat-Resina, X. (2014). Connecting Analytics and Curriculum Design: Process and Outcomes of Building a Tool to Browse Data Relevant to Course Designers. Journal of Learning Analytics, 1(3), 220–240.
iSEAL Design Documentation. (2010). iSEAL Design Documentation. University of Minnesota Board of Regents.
Lund, B. (2012, November 16). UMR Software Breaks New Ground. Rochester Post Bulletin. Rochester, Minnesota. Retrieved from http://www.postbulletin.com/business/umr-software-breaks-new-ground/article_15bb3858-8db5-5fb2-a7b8-c9b74f1100b1.html
Neuhauser, C. (2012). From Academic Analytics to Individualized Education. In A. H. Duin, E. A. Nater, & F. X. Anklesaria (Eds.), Cultivating Change in the Academy: 50+ Stories from the Digital Frontlines at the University of Minnesota in 2012, An Open-Source eBook (pp. 188–193). University of Minnesota. Retrieved from http://conservancy.umn.edu/handle/125273
Neuhauser, C., Mondal, A., & Lin, Z. (2009, January). ISEAL. Rochester, Minnesota
Acknowledgements
We would like to thank the Provost Office for financial support (The Undergraduate Digital Technology Grant). The authors are grateful to the University of Minnesota Rochester web development team, IT staff on the Twin Cities Campus, and all the faculty of the CLI whose input throughout the process contributed to the development of this project.
