3 Financial Statements
INTRODUCTION
Measuring by counting, by adding it all up, by taking stock, is probably as old as any human activity.
In financial planning, assessing the current situation is crucial to determining any sort of financial plan. This assessment is the point of departure for any strategy. It becomes the mark from which any progress is measured, the principal from which any return is calculated. It can determine your practical or realistic goals and the strategies to achieve them. Eventually, the current situation becomes a time forgotten with the pride of success, or remembered with the regret of failure.
Understanding the current situation is not just a matter of measuring it, but also of putting it in perspective and in context, relative to your own past performance and future goals, and relative to the realities of the economic world around you. Tools for understanding your current situation are your accounting and financial statements.
3.1 ACCOUNTING AND FINANCIAL STATEMENTS
Learning Objectives
- Distinguish between accrual and cash accounting.
- Compare and contrast the three common financial statements.
- Identify the results shown on the income statement, balance sheet, and cash flow statement.
- Explain the calculation and meaning of net worth.
- Trace how a bankruptcy can occur.
Clay tablets interested Sumerian traders because the records gave them a way to see their financial situation and to use that insight to measure progress and plan for the future. The method of accounting universally used in business today is known as accrual accounting. In this system events are accounted for even if cash does not change hands. That is, transactions are recorded at the time they occur rather than when payment is actually made or received. Anticipated or preceding payments and receipts (cash flows) are recorded as accrued or deferred. Accrual accounting is the opposite of cash accounting, in which transactions are recognized only when cash is exchanged.
Accrual accounting defines earning as an economic event signified by an exchange of goods rather than by an exchange of cash. In this way, accrual accounting allows for the separation in time of the exchange of goods and the exchange of cash. A transaction can be completed over time and distance, which allows for extended—and extensive—trade. Another advantage of accrual accounting is that it gives a business a more accurate picture of its present situation.
In personal finance, it almost always makes more sense to use cash accounting, to define and account for events when the cash changes hands. As a result, incomes and expenses are noted when the cash is received or paid, or when the cash flows.
The Accounting Process
Financial decisions result in transactions, actual trades that buy or sell, invest or borrow. In the market economy, something is given up in order to get something, so each trade involves at least one thing given up and one thing gotten—two things flowing in at least two directions. The process of accounting records these transactions and records what has been gotten and what has been given up in exchange, what flows in and what flows out.
In business, accounting journals and ledgers are set up to record transactions as they happen. In personal finance, a chequebook records most transactions, with statements from banks or investment accounts providing records of the rest. Periodically, the transaction information is summarized in financial statements so it can be read most efficiently.
Events are recorded through bookkeeping—the process of recording what, how, and by how much a transaction affects the financial situation. Since the advent of accounting software, bookkeeping, like long division and spelling, has become somewhat obsolete, although human judgment is still required. What is more interesting and useful are the summary reports that can be produced once all this information is recorded: the income statement, cash flow statement, and balance sheet.
Income Statement
The income statement summarizes incomes and expenses for a period of time. In business, income is the value of whatever is sold, expenses are the costs of earning that income, and the difference is profit. In personal finance, income is what is earned as wages or salary and as interest or dividends, and expenses are the costs of things consumed in the course of daily living: the costs of sustaining you while you earn income. Thus, the income statement is a measure of what you have earned and what your cost of living was while earning it. The difference is personal profit, which, if accumulated as investment, becomes your wealth.
The income statement clearly shows the relative size of your income and expenses. If income is greater than expenses, there is a surplus, and that surplus can be used to save or to spend more (and create more expenses). If income is less than expenses, then there is a deficit that must be addressed. If the deficit continues, it creates debts—unpaid bills—that must eventually be paid. Over the long term, a deficit is not a viable scenario.
The income statement can be useful for its level of detail too. You can see which of your expenses consumes the greatest portion of your income or which expense has the greatest or least effect on your bottom line. If you want to reduce expenses, you can see which would have the greatest impact or would free up more income if you reduced it. If you want to increase income, you can see how much more that would buy you in terms of your expenses. For example, consider Brittany’s situation in Table 3.1.1.
|
Gross wages |
44,650 |
|
Income taxes and deductions |
8,930 |
|
Rent expense |
10,800 |
|
Living expenses |
14,400 |
In addition to the figures outlined above, Brittany also had car payments of $2,400 and student loan payments of $7,720. Each loan payment actually covers the interest expense and partial repayment of the loan. The interest is an expense representing the cost of borrowing, and thus of having, the car and the education. The repayment of the loan is not an expense, however, but is just giving back something that was borrowed. The loan payments breakdown is shown in Table 3.1.2.
|
|
Interest |
Debt Repayment |
|
Car Loan |
240 |
2,160 |
|
Student Loan |
4,240 |
3,480 |
Breaking down Brittany’s living expenses in more detail and adding in her interest expenses, Brittany’s income statement would look like Table 3.1.3.
|
Gross wages |
|
44,650 |
|
Income taxes and deductions |
8,930 |
|
|
Disposable income |
|
35,720 |
|
Rent |
10,800 |
|
|
Food |
3,900 |
|
|
Car expenses |
3,600 |
|
|
Clothing |
1,800 |
|
|
Cell phone |
1,200 |
|
|
Internet and cable TV |
1,200 |
|
|
Entertainment, travel, etc. |
2,700 |
|
|
Total living expenses |
|
25,200 |
|
Car loan interest |
240 |
|
|
Student loan interest |
4,240 |
|
|
Total interest expenses |
|
4,480 |
|
Net income |
|
6,040 |
Brittany’s disposable income, or income to meet expenses after taxes have been accounted for, is $35,720. Brittany’s net income, or net earnings or personal profit, is the remaining income after all other expenses have been deducted, in this case $6,040.
Now Brittany has a much clearer view of what’s going on in her financial life. She can see, for example, that living expenses take the biggest bite out of her income and that rent is her biggest single expense. If she wanted to decrease expenses, finding a place to live with a cheaper rent will make the most impact on her bottom line. Or perhaps it would make more sense to make many small changes rather than one large change. She could begin by cutting back on the expense items that she feels are least necessary or that she could most easily live without. Perhaps she could do with less entertainment or clothing or travel, for example. Whatever choices she subsequently made would be reflected in her income statement. The value of the income statement is in presenting income and expenses in detail for a particular period of time.
Cash Flow Statement
The cash flow statement shows how much cash came in and where it came from, and how much cash went out and where it went, over a specific period of time. This differs from the income statement because it may include cash flows that are not from income and expenses. Examples of such cash flows would be receiving repayment of money that you loaned, repaying money that you borrowed, or using money in exchanges such as buying or selling an asset.
The cash flow statement is important because it can show how well you do at creating liquidity, as well as your net income. Liquidity is nearness to cash, and liquidity has value. An excess of liquidity can be sold or lent, creating additional income. A lack of liquidity must be addressed by buying it or borrowing, creating additional expense.
Looking at Brittany’s situation, she has two loan repayments that are not expenses and so are not included on her income statement. These payments reduce her liquidity, however, making it harder for her to create excess cash. Table 3.1.4 shows what Brittany’s cash flow statement looks like.
|
Cash from gross wages |
44,650 |
|
Cash paid for: |
|
|
Income taxes and deductions |
(8,930) |
|
Rent |
(10,800) |
|
Food |
(3,900) |
|
Car expenses |
(3,600) |
|
Clothing |
(1,800) |
|
Cell phone |
(1,200) |
|
Internet and cable TV |
(1,200) |
|
Entertainment, travel, etc. |
(2,700) |
|
Car loan interest |
(240) |
|
Student loan interest |
(4,240) |
|
Cash for repayment of car loan |
(2,160) |
|
Cash for repayment of student loan |
(3,480) |
|
Net cash flow |
400 |
Note that on a cash flow statement, negative and positive numbers indicate direction of flow. A negative number is cash flowing out, and a positive number is cash flowing in. Conventionally, negative numbers are in parentheses.
As with the income statement, the cash flow statement is more useful if there are subtotals for the different kinds of cash flows, as defined by their sources and uses. The cash flows from income and expenses are operating cash flows, or cash flows that are a consequence of earning income or paying for the costs of earning income. The loan repayments are cash flows from financing assets or investments that will increase income. In this case, cash flows from financing include repayments on the car and the education. Although Brittany doesn’t have any in this example, there could also be cash flows from investing, from buying or selling assets. Free cash flow is the cash available to make investments or finance decisions after taking care of operations and debt obligations. It is calculated as cash flow from operations less debt repayments. Net cash flow is the gain or loss of funds over a period after all operation expenses, debts, and investment activities are paid for. The most significant difference between the three categories of cash flows—operating, investing, or financing—is whether or not the cash flows may be expected to recur regularly. Operating cash flows recur regularly; they are the cash flows that result from income and expenses or consumption, and therefore can be expected to occur every year. Operating cash flows may be different amounts in different periods, but they will happen in every period. Investing and financing cash flows, on the other hand, may or may not recur, and indeed are often unusual events. Typically, for example, you would not borrow or lend or buy or sell assets in every year. Table 3.1.5 illustrates how Brittany’s cash flows would be classified.
|
Cash from gross wages |
44,650 |
|
|
Cash paid for: |
|
|
|
Income taxes and deductions |
(8,930) |
|
|
Rent |
(10,800) |
|
|
Food |
(3,900) |
|
|
Car expenses |
(3,600) |
|
|
Clothing |
(1,800) |
|
|
Cell phone |
(1,200) |
|
|
Internet and cable TV |
(1,200) |
|
|
Entertainment, travel, etc. |
(2,700) |
|
|
Car loan interest |
(240) |
|
|
Student loan interest |
(4,240) |
|
|
Operating cash flows |
|
6,040 |
|
Cash for repayment of car loan |
(2,160) |
|
|
Cash for repayment of student loan |
(3,480) |
|
|
Financing cash flows |
|
(5,640) |
|
Net cash flow |
|
400 |
This cash flow statement more clearly shows how liquidity is created and where liquidity could be increased. If Brittany wanted to create more liquidity, it is obvious that eliminating those loan payments would be a big help.
Balance Sheet
In business or in personal finance, a critical piece in assessing the current situation is the balance sheet. Often referred to as the “statement of financial condition,” the balance sheet is a snapshot of what you have and what you owe at a given point in time. Unlike income or cash flow statements, it is not a record of performance over a period of time, but simply a statement of where things stand at a certain moment.
The balance sheet is a list of assets, debts or liabilities, and equity or net worth, with their values. In business, assets are resources that can be used to create income, while debt and equity are the capital that financed those assets. Thus, the value of the assets must equal the value of the debt and the equity. In other words, the value of the business’s resources must equal the value of the capital it borrowed or bought in order to get those resources.
assets = liabilities + equity
In business, the accounting equation is as absolute as the law of gravity. It simply must always be true, because if there are assets, they must have been financed somehow—either through debt or equity. The value of that debt and equity financing must equal or balance the value of the assets it bought. Thus, it is called the “balance” sheet because it always balances the debt and equity with the value of the assets.
In personal finance, assets are also things that can be sold to create liquidity. Liquidity is needed to satisfy or repay debts. Because your assets are what you use to satisfy your debts when they become due, the assets’ value should be greater than the value of your debts. That is, you should have more to work with to meet your obligations than you owe.
The difference between what you have and what you owe is your net worth. Literally, net worth is everything that you own. It is the value of what you have net of (less) what you owe to others. Whatever asset value is left over after you meet your debt obligations is your own worth. It is the value of what you have that you can claim free and clear.
assets − debt = net worth
Your net worth is really your equity or financial ownership in your own life. Here, too, the personal balance sheet must balance, because if
assets − debt = net worth
then it should also be
assets = debt + net worth
It is important to note that the prices of most assets fluctuate, but many debts are fixed so that net worth can change as a result of market fluctuations in asset prices.
Brittany could write a simple balance sheet to see her current financial condition. She has two assets (her car and her savings account), and she has two debts (her car and student loans), as illustrated in Table 3.1.6.
|
Assets |
Liabilities |
|
Car: 5,000 |
Car Loan: 2,700 |
|
Savings: 250 |
Student Loan: 53,000 |
|
Total: 5,250 |
Total: 55,700 |
|
|
Net Worth: (50,450) |
Brittany’s balance sheet presents her with a much clearer picture of her financial situation, but also with a dismaying prospect: she seems to have negative net worth. Negative net worth results whenever the value of debts or liabilities is actually greater than the assets’ value.
Net worth is positive if liabilities<assets; assets − liabilities>0; net worth>0
Net worth is negative if liabilities>assets; assets − liabilities<0; net worth<0
Negative net worth implies that the assets don’t have enough value to satisfy the debts. Since debts are obligations, this would cause some concern.
Net Worth and Bankruptcy
In business, when liabilities are greater than the assets to meet them, the business has negative equity and is literally bankrupt. In that case, it may go out of business, selling all its assets and giving whatever it can to its creditors or lenders, who will have to settle for less than what they are owed. More usually, the business continues to operate in bankruptcy, if possible, and must still repay its creditors, although perhaps under somewhat easier terms. Creditors (and the laws) allow these terms because creditors would rather get paid in full later than get paid less now or not at all.
In personal finance, personal bankruptcy may occur when debts are greater than the value of assets. But because creditors would rather be paid eventually than never, the bankrupt person is usually allowed to continue to earn income in the hopes of repaying the debt later or with easier terms. Often, the bankrupt person is forced to liquidate (sell) some or all of his or her assets.
Because debt is a legal as well as an economic obligation, there are laws governing bankruptcies that differ from province to province and from country to country. For more information on bankruptcy, see Chapter 7 “Financial Management.”
The use of another’s property or wealth is a serious responsibility, so debt is a serious obligation.
However, Brittany’s case is actually not as dismal as it looks, because Brittany has an “asset” that is not listed on her balance sheet—that is, her education. It is not listed on her balance sheet because the value of her education, like the value of any asset, comes from how useful it is, and its usefulness has not happened yet, but will happen over her lifetime, based on how she chooses to use her education to increase her income and wealth. It is difficult to assign a monetary value to her education now. Brittany knows what she paid for her education, but, sensibly, its real value is not its cost but its potential return, or what it can earn for her as she puts it to use in the future.
Current studies show that a university education has economic value because a university graduate earns more over a lifetime than a high school graduate (Statistics Canada, 2017; Berger and Parkin, 2016; Baum, Ma, and Payea, 2013). How much more one will earn varies and is dependent on a number of different variables such as your geographical location and the degree pursued.
If Brittany assumes that her education will be worth $1,000,000 in extra income over her lifetime, and she includes that asset value on her balance sheet, then it would look more like what is listed in Table 3.1.7.
|
Assets |
Liabilities |
|
Car: 5,000 |
Car Loan: 2,700 |
|
Savings: 250 |
Student Loan: 53,000 |
|
Education: 1,000,000 |
Total: 55,700 |
|
Total: 1,005,250 |
Net Worth: 949,550 |
This looks much better, but it’s not sound accounting practice to include an asset—and its value—on the balance sheet before it really exists. After all, education generally pays off, but until it does, it hasn’t yet and there is a chance, however slim, that it won’t for Brittany. A balance sheet is a snapshot of one’s financial situation at one particular time. At this particular time, Brittany’s education has value, but its amount is unknown.
It is easy to see, however, that the only thing that creates negative net worth for Brittany is her student loan. The student loan causes her liabilities to be greater than her assets—and if that were paid off, her net worth would be positive. Given that Brittany is just starting her adult earning years, her situation seems quite reasonable.
Key Takeaways
- Three commonly used financial statements are the income statement, the cash flow statement, and the balance sheet.
- Results for a period are shown on the income statement and the cash flow statement. Current conditions are shown on the balance sheet.
- The income statement lists income and expenses.
- The cash flow statement lists three kinds of cash flows: operating (recurring), financing (nonrecurring), and investing (nonrecurring).
- The balance sheet lists assets, liabilities (debts), and net worth.
- Net worth = assets − debts.
- Bankruptcy occurs when there is negative net worth, or when debts are greater than assets.
Exercises
- Prepare a personal income statement for the past year, using the same format as Brittany’s income statement in this chapter. Include all relevant categories of income and expenses. What does your income statement tell you about your current financial situation? For example, where does your income come from, and where does it go? Do you have a surplus of income over expenses? If so, what are you doing with the surplus? Do you have a deficit? What can you do about that? Which of your expenses has the greatest effect on your bottom line? What is the biggest expense? Which expenses would be easiest to reduce or eliminate? How else could you reduce expenses? Realistically, how could you increase your income? How would you like your income statement for the next year to look?
- Using the format for Brittany’s cash flow statement, prepare your cash flow statement for the same one-year period. Include your cash flows from all sources in addition to your operating cash flows: the income and expenses that appear on your income statement. What, if any, were the cash flows from financing and the cash flows from investing? Which of your cash flows are recurring, and which are nonrecurring? What does your cash flow statement tell you about your current financial situation? If you wanted to increase your liquidity, what would you try to change about your cash flows?
- Prepare a balance sheet, again based on Brittany’s form. List your assets, liabilities, and debts, and equity from all sources. What does the balance sheet show about your financial situation at this moment in time? What is your net worth? Do you have positive or negative net worth at this time, and what does that mean? To increase your liquidity, how would your balance sheet need to change? What would be the relationship between your cash flow statement and your budget?
REFERENCES
Baum, S.,, J. Ma, and Payea, K. (2013). Education Pays: The Benefits of Higher Education for Individuals and Society. Princeton, NJ: The College Board.
Berger, J., Motte, A. and Parkin, A. (2009). The Price of Knowledge: Access and Student Finance in Canada. Montreal: The Canada Millenium Scholarship Foundation. Retrieved from http://www.yorku.ca/pathways/literature/Access/The Price of Knowledge 2009.pdf.
Statistics Canada. (2017). Does Education Pay? A Comparison of earnings by level of education in Canada and its provinces. Retrieved from: https://www12.statcan.gc.ca/census-recensement/2016/as-sa/98-200-x/2016024/98-200-x2016024-eng.cfm.
3.2 COMPARING AND ANALYZING FINANCIAL STATEMENTS
Learning Objectives
- Explain the use of common-size statements in financial analysis.
- Discuss the design of each common-size statement.
- Demonstrate how changes in the balance sheet may be explained by changes on the income and cash flow statements.
- Identify the purposes and uses of ratio analysis.
- Describe the uses of comparing financial statements over time.
Financial statements are valuable summaries of financial activities because they can organize information and make it easier to see and therefore to understand. Each one—the income statement, cash flow statement, and balance sheet—conveys a different aspect of the financial picture; viewed together, the picture is pretty complete. The three provide a summary of earning and expenses, of cash flows, and of assets and debts.
Since the three statements offer three different kinds of information, sometimes it is useful to look at each in the context of the others, and to look at specific items in this larger context. This is the purpose of financial statement analysis: creating comparisons and contexts to gain a better understanding of the financial picture.
Common-Size Statements
On common-size statements, each item’s value is listed as a percentage of another. This compares items, showing their relative size and their relative significance (see Table 3.2.1 “Common Common-Size Statements”). On the income statement, each income and expense may be listed as a percentage of the total income. This shows the contribution of each kind of income to the total, and thus the diversification of income. It shows the burden of each expense on total income or how much income is needed to support each expense.
On the cash flow statement, each cash flow can be listed as a percentage of total positive cash flows, again showing the relative significance and diversification of the sources of cash, and the relative size of the burden of each use of cash.
On the balance sheet, each item is listed as a percentage of total assets, showing the relative significance and diversification of assets, and highlighting the use of debt as financing for the assets.
|
|
Income Statement |
Cash Flow Statement |
Balance Sheet |
|
Items as a % of |
Total Income |
Total Positive Cash Flows |
Total Assets |
Brittany can look at a common-size income statement by looking at her expenses as a percentage of her income and comparing the size of each expense to a common denominator: her income. This shows her how much of her income, proportionately, is used up for each expense.
|
Gross wages |
|
44,650 |
|
100.00% |
|
Income taxes and deductions |
8,930 |
|
20.00% |
|
|
Disposable income |
|
35,720 |
|
80.00% |
|
Rent |
10,800 |
|
24.19% |
|
|
Food |
3,900 |
|
8.73% |
|
|
Car expenses |
3,600 |
|
8.06% |
|
|
Clothing |
1,800 |
|
4.03% |
|
|
Cell phone |
1,200 |
|
2.69% |
|
|
Internet and cable TV |
1,200 |
|
2.69% |
|
|
Entertainment, travel, etc. |
2,700 |
|
6.05% |
|
|
Total living expenses |
|
25,200 |
|
56.44% |
|
Car loan interest |
240 |
|
0.54% |
|
|
Student loan interest |
4,240 |
|
9.50% |
|
|
Total interest expenses |
|
4,480 |
|
10.03% |
|
Net income |
|
6,040 |
|
13.53% |
Seeing the common-size statement as a pie chart makes the relative size of the slices even clearer.
Chart 3.2.1 Brittany’s Common-Size Income Statement for the Year 2016
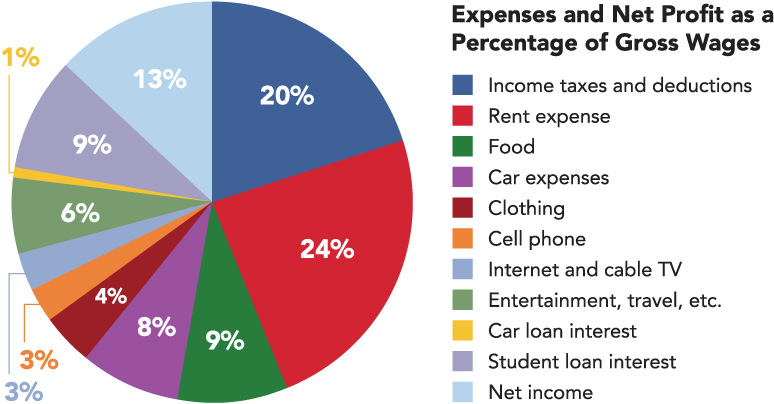
The biggest discretionary use of Brittany’s wages is her rent expense, followed by food, car expenses, and entertainment. Her income tax expense is a big use of her wages, but it is unavoidable or nondiscretionary.
Ranking expenses by size offers interesting insight into lifestyle choices. It is also a valuable way of framing financial decisions, pointing out which expenses have the largest impact on income and thus on the resources for making financial decisions. If Brittany wanted more discretionary income to make more or different choices, she could easily see that reducing rent expense would have the most impact on freeing up some of her wages for another use.
Common-Size Cash Flow Statement
Looking at Brittany’s negative cash flows as percentages of her positive cash flow (on the cash flow statement), or the uses of cash as percentages of the sources of cash, creates the common-size cash flows. As with the income statement, this gives Brittany a clearer and more immediate view of the largest uses of her cash, as can be seen in Table 3.2.3.
|
Cash from gross wages |
44,650 |
|
100.00% |
|
Cash paid for: |
|
|
|
|
Income taxes and deductions |
(8,930) |
|
-20.00% |
|
Rent |
(10,800) |
|
-24.19% |
|
Food |
(3,900) |
|
-8.73% |
|
Car expenses |
(3,600) |
|
-8.06% |
|
Clothing |
(1,800) |
|
-4.03% |
|
Cell phone |
(1,200) |
|
-2.69% |
|
Internet and cable TV |
(1,200) |
|
-2.69% |
|
Entertainment, travel, etc. |
(2,700) |
|
-6.05% |
|
Car loan interest |
(240) |
|
-0.54% |
|
Student loan interest |
(4,240) |
|
-9.50% |
|
Operating cash flows |
|
6,040 |
13.53% |
|
Cash for repayment of car loan |
(2,160) |
|
-4.84% |
|
Cash for repayment of student loan |
(3,480) |
|
-7.79% |
|
Financing cash flows |
|
(5,640) |
-12.63% |
|
Net cash flow |
|
400 |
0.00% |
Chart 3.2.2 Brittany’s Common-Size Cash Flow Statement
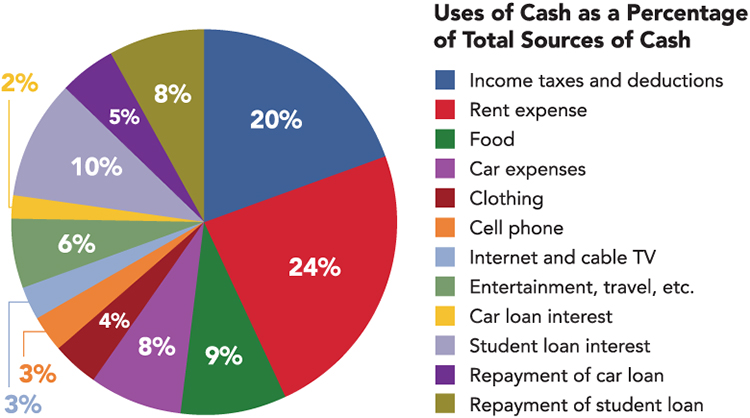
Again, rent is the biggest discretionary use of cash for living expenses, but debts demand the most significant portion of cash flows. Repayments and interest together are 30 per cent of Brittany’s cash—as much as she pays for rent and food. Eliminating those debt payments would create substantial liquidity for Brittany.
Common-Size Balance Sheet
On the balance sheet, looking at each item as a percentage of total assets allows for measuring how much of the assets’ value is obligated to cover each debt, or how much of the assets’ value is claimed by each debt.
|
Assets |
Liabilities |
||||
| Car | 5,000 | 95% | Car Loan | 2,700 | 51% |
| Savings | 250 | 5% | Student Loan | 53,000 | 1,010% |
| Total | 5,250 | 100% | Total | 55,700 | 1,061% |
| Net Worth | (50,450) | (961%) | |||
This common-size balance sheet allows “over-sized” items to be more obvious. For example, it is immediately obvious that Brittany’s student loan dwarfs her assets’ value and creates her negative net worth.
Common-size statements allow you to look at the size of each item relative to a common denominator: total income on the income statement, total positive cash flow on the cash flow statement, or total assets on the balance sheet. The relative size of the items helps you spot anything that seems disproportionately large or small. The common-size analysis is also useful for comparing the diversification of items on the financial statement—the diversification of incomes on the income statement, cash flows on the cash flow statement, and assets and liabilities on the balance sheet. Diversification reduces risk, so you want to diversify the sources of income and assets you can use to create value.
Chart 3.2.3 Pie Chart of Brittany’s Common-Size Balance Sheet: The Assets
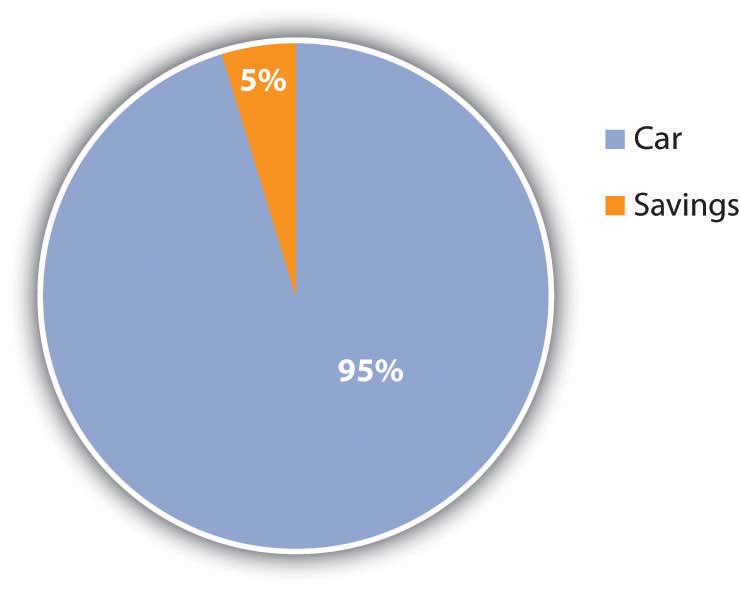
For example, Brittany has only two assets, and one—her car—provides 95 per cent of her assets’ value. If something happened to her car, her assets would lose 95 per cent of their value. Her asset value would be less exposed to risk if she had asset value from other assets to diversify the value invested in her car.
Likewise, both her income and her positive cash flows come from only one source, her paycheque. Because her positive net earnings and positive net cash flows depend on this one source, she is exposed to risk, which she could decrease by diversifying her sources of income. She could diversify by adding earned income—taking on a second job, for example—or by creating investment income. In order to create investment income, however, she needs to have a surplus of liquidity, or cash, to invest. Brittany has run head-first into Adam Smith’s “great difficulty”: that it takes some money to make money (see Chapter 2 “Basic Ideas of Finance”).
Relating the Financial Statements
Common-size statements highlight the details of the financial statements relative to a common factor for each statement. But each financial statement is also related to the others, and as important as it is to see each individual piece, it is also important to see that larger picture. To make sound financial decisions, you need to be able to foresee the consequences of a decision, to understand how a decision may affect the different aspects of the bigger picture.
For example, what happens in the income statement and cash flow statements is reflected on the balance sheet because the earnings and expenses and the other cash flows affect the asset values and the values of debts, and thus the net worth. Cash may be used to purchase assets, so a negative cash flow may increase assets. Cash may be used to pay off debt, so a negative cash flow may decrease liabilities. Cash may be received when an asset is sold, so a decrease to assets may create positive cash flow. Cash may be received when money is borrowed, so an increase in liabilities may create a positive cash flow.
There are many other possible scenarios and transactions, but you can begin to see that the balance sheet at the end of a period is changed from what it was at the beginning of the period by what happens during the period, and what happens during the period is shown on the income statement and the cash flow statement. So, as shown in Chart 3.2.4, the income statement and cash flow information, related to each other, also relate the balance sheet at the end of the period to the balance sheet at the beginning of the period.
Chart 3.2.4 Relationships among Financial Statements
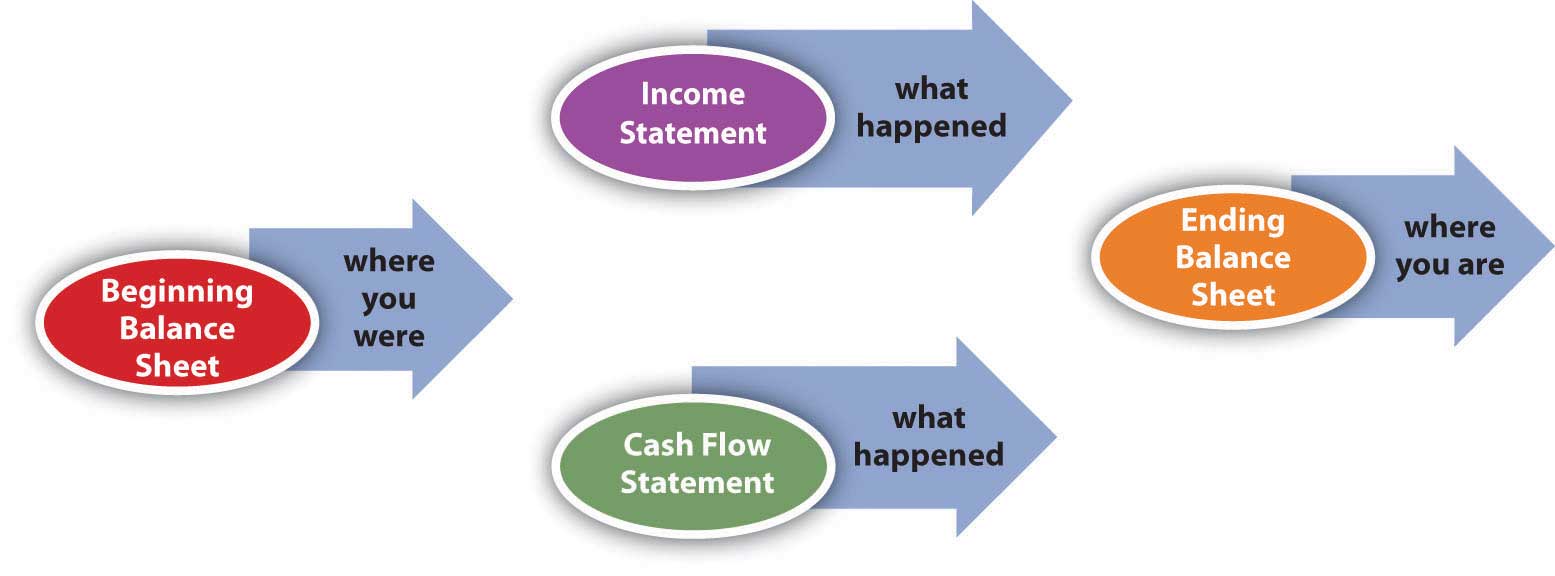
The significance of these relationships becomes even more important when evaluating alternatives for financial decisions. When you understand how the statements are related, you can use that understanding to project the effects of your choices on different aspects of your financial reality and see the consequences of your decisions.
Ratio Analysis
Creating ratios is another way to see the numbers in relation to each other. Any ratio shows the relative size of the two items compared, just as a fraction compares the numerator to the denominator or a percentage compares a part to the whole. The percentages on the common-size statements are ratios, although they only compare items within a financial statement. Ratio analysis is used to make comparisons across statements. For example, you can see how much debt you have just by looking at your total liabilities, but how can you tell if you can afford the debt you have? That depends on the income you have to meet your interest and repayment obligations, or the assets you could use (sell) to meet those obligations. Ratio analysis can give you the answer.
The financial ratios you use depend on the perspective you need or the question(s) you need answered. Some of the more common ratios (and questions) are presented in Table 3.2.5.
|
Ratio |
Calculation |
Question it helps to answer |
|
Net income margin |
Net income / |
How much income is used up by expenses? |
|
Return on assets |
Net income / |
How big is the income supporting the assets? |
|
Return on net worth |
Net income / |
How big is income relative to net worth? |
|
Debt to assets |
Total debt / |
How much asset value is financed by debt? Or how much asset value is there to satisfy debt? |
|
Total debt |
Total debt / |
How large is debt relative to net worth? |
|
Interest coverage |
Income before interest/ |
How well does income cover interest expenses? |
|
Cash flow to income |
Net cash flow / |
How much do payments for investments and financing take from income? |
|
Cash flow to assets |
Net cash flow / |
How much cash flow supports assets? |
These ratios all get “better” or show improvement as they get bigger, with two exceptions: debt to assets and total debt. Those two ratios measure levels of debt, and the smaller the ratio, the less the debt. Ideally, the two debt ratios would be less than one. If your debt-to-assets ratio is greater than one, then debt is greater than assets, and you are bankrupt. If the total debt ratio is greater than one, then debt is greater than net worth, and you “own” less of your assets’ value than your creditors do.
Some ratios will naturally be less than one, but the bigger they are, the better. For example, net income margin will always be less than one because net income will always be less than total income (net income = total income − expenses). The larger that ratio is, and the fewer expenses that are taken away from the total income, the better.
Some ratios should be greater than one, and the bigger they are, the better. For example, the interest coverage ratio should be greater than one, because you should have more income to cover interest expenses than you have interest expenses, and the more you have, the better. Table 3.2.6 suggests what to look for in the results of your ratio analyses.
|
Ratio |
Calculation |
Question it helps to answer |
Better as it gets… |
|
Net income margin |
Net income / |
How much income is used up by expenses? |
Bigger |
|
Return on assets |
Net income / |
How big is the income supporting the assets? |
Bigger |
|
Return on net worth |
Net income / |
How big is income relative to net worth? |
Bigger |
|
Debt to assets |
Total debt / |
How much asset value is financed by debt? Or how much asset value is there to satisfy debt? |
Smaller: |
|
Total debt |
Total debt / |
How large is debt relative to net worth? |
Smaller: |
|
Interest coverage |
Income before interest/ |
How well does income cover interest expenses? |
Bigger: |
|
Cash flow to income |
Net cash flow / |
How much do payments for investments and financing take from income? |
Bigger |
|
Cash flow to assets |
Net cash flow / |
How much cash flow supports assets? |
Bigger |
While you may have a pretty good “feel” for your situation just by paying the bills and living your life, it often helps to have the numbers in front of you. Table 3.2.7 illustrates Brittany’s ratio analysis for 2016.
|
Ratio |
Calculation |
Result |
|
Net income margin |
Net income / Total income |
0.1353 |
|
Return on assets |
Net income / Total assets |
1.1505 |
|
Return on net worth |
Net income / Net worth |
(0.1197) |
|
Debt to assets |
Total debt / Total assets |
10.6095 |
|
Interest coverage |
Income before interest/ Interest expense |
2.3482 |
|
Cash flow to income |
Net cash flow / Net income |
0.0662 |
|
Cash flow to assets |
Net cash flow / Total assets |
0.0762 |
The ratios that involve net worth—return on net worth and total debt—are negative for Brittany because she has negative net worth (her debts are larger than her assets). She can see how much larger her debt is than her assets by looking at her debt-to-assets ratio. Although she has a lot of debt (relative to assets and to net worth), she can earn enough income to cover its cost or interest expense, as shown by the interest coverage ratio.
Brittany is earning well. Her income is larger than her assets. She is able to live efficiently. Her net income is a healthy 13.53 per cent of her total income (net income margin), which means that her expenses are only 86.47 per cent of it, but her cash flows are much less (cash flow to income), meaning that a significant portion of earnings is used up in making investments or, in Brittany’s case, debt repayments. In fact, her debt repayments don’t leave her with much free cash flow—that is, cash flow not used up on living expenses or debts.
Looking at the ratios, it is even more apparent how much—and yet how subtle—of a burden Brittany’s debt is. In addition to giving her negative net worth, it keeps her from increasing her assets and creating positive net worth—and potentially more income—by obligating her to use up her cash flows. Debt repayment keeps her from being able to invest.
Currently, Brittany can afford the interest and the repayments. Her debt does not keep her from living her life, but it does limit her choices, which in turn restricts her decisions and future possibilities.
Comparisons Over Time
Another useful way to compare financial statements is to look at how the situation has changed over time. Comparisons over time provide insights into the effects of past financial decisions and changes in circumstance. That insight can guide you in making future financial decisions, particularly in foreseeing the potential costs or benefits of a choice. Looking backward can be very helpful in looking forward.
Fast-forward ten years: Brittany is now in her early thirties. Her career has progressed and her income has grown. She has paid off her student loan and has begun to save for retirement and perhaps a down payment on a house.
A comparison of Brittany’s financial statements shows the change over the decade, both in absolute dollar amounts and as a percentage (see the following tables: Table 3.2.8 “Brittany’s Income Statements: Comparison Over Time,” Table 3.2.9 “Brittany’s Cash Flow Statements: Comparison Over Time,” and Table 3.2.10 “Brittany’s Balance Sheets: Comparison Over Time”). For the sake of simplicity, this example assumes that neither inflation nor deflation have significantly affected currency values during this period.
|
For Year Ending |
12/31/16 |
12/31/26 |
Change |
% Change |
|
Gross wages |
44,650 |
74,000 |
29,350 |
65.73% |
|
Income taxes and deductions |
8,930 |
18,500 |
9,570 |
107.17% |
|
Disposable income |
35,720 |
55,500 |
19,780 |
55.38% |
|
Rent |
10,800 |
18,000 |
7,200 |
66.67% |
|
Food |
3,900 |
3,900 |
0 |
0.00% |
|
Car expenses |
3,600 |
3,600 |
0 |
0.00% |
|
Clothing |
1,800 |
1,800 |
0 |
0.00% |
|
Cell phone |
1,200 |
1,200 |
0 |
0.00% |
|
Internet and cable TV |
1,200 |
1,200 |
0 |
0.00% |
|
Entertainment, travel, etc. |
2,700 |
5,200 |
2,500 |
92.59% |
|
Total living expenses |
25,200 |
34,900 |
9,700 |
38.49% |
|
Car loan interest |
240 |
757 |
517 |
215.42% |
|
Student loan interest |
4,240 |
0 |
4,240 |
-100.00% |
|
Total interest expenses |
4,480 |
757 |
3,723 |
-83.10% |
|
Net income |
6,040 |
19,843 |
13,803 |
228.53% |
|
For Year Ending |
12/31/16 |
12/31/26 |
Change |
% Change |
|
Cash from gross wages |
44,650 |
74,000 |
29,350 |
65.73% |
|
Cash paid for: |
||||
|
Income taxes and deductions |
(8,930) |
(18,500) |
9,570 |
107.17% |
|
Rent |
(10,800) |
(18,000) |
7,200 |
66.67% |
|
Food |
(3,900) |
(3,900) |
0 |
0.00% |
|
Car expenses |
(3,600) |
(3,600) |
0 |
0.00% |
|
Clothing |
(1,800) |
(1,800) |
0 |
0.00% |
|
Cell phone |
(1,200) |
(1,200) |
0 |
0.00% |
|
Internet and cable TV |
(1,200) |
(1,200) |
0 |
0.00% |
|
Entertainment, travel, etc. |
(2,700) |
(5,200) |
2,500 |
92.59% |
|
Car loan interest |
(240) |
(757) |
517 |
215.42% |
|
Student loan interest |
(4,240) |
0 |
4,240 |
-100.00% |
|
Operating cash flows |
6,040 |
19,843 |
13,803 |
228.53% |
|
Cash invested in RRSP |
0 |
(3,000) |
3,000 |
100.00% |
|
Cash invested in car |
0 |
(6,300) |
6,300 |
100.00% |
|
Investing cash flows |
0 |
(9,300) |
9,300 |
100.00% |
|
Cash for repayment of car loan |
(2,160) |
(4,610) |
2,450 |
113.43% |
|
Cash for repayment of student loan |
(3,480) |
|
|
-100.00% |
|
Financing cash flows |
(5,640) |
(4,610) |
1,030 |
-18.26% |
|
Net cash flow |
400 |
5,933 |
5,533 |
1383.25% |
|
As of |
12/31/16 |
12/31/26 |
Change |
% Change |
|
Assets |
||||
|
Cash/Chequing |
0 |
5,000 |
5,000 |
100.00% |
|
Savings |
250 |
250 |
0 |
0.00% |
|
Money Market |
0 |
2,600 |
2,600 |
100.00% |
|
Pension |
0 |
13,000 |
13,000 |
100.00% |
|
RRSP |
0 |
7,400 |
7,400 |
100.00% |
|
Car |
5,000 |
15,000 |
10,000 |
200.00% |
|
Total assets |
5,250 |
43,250 |
38,000 |
723.81% |
|
Liabilities |
||||
|
Car loan |
2,700 |
4,610 |
1,910 |
70.74% |
|
Student loan |
53,000 |
0 |
53,000 |
-100.00% |
|
Total liabilities |
55,700 |
4,610 |
51,090 |
-91.72% |
|
Net worth |
-50,450 |
38,640 |
89,090 |
176.59% |
Starting with the income statement, Brittany’s income has increased. Her income tax withholding and deductions have also increased, but she still has higher disposable income (take-home pay). Many of her living expenses have remained consistent; rent and entertainment have increased. Interest expense on her car loan has increased, but since she has paid off her student loan, that interest expense has been eliminated, so her total interest expense has decreased. Overall, her net income, or personal profit—what she clears after covering her living expenses—has almost doubled.
Her cash flows have also improved. Operating cash flows, like net income, have almost doubled—due primarily to eliminating the student loan interest payment. The improved cash flow allowed her to make a down payment on a new car, invest in her RRSP, make the payments on her car loan, and still increase her net cash flow by a factor of ten.
Brittany’s balance sheet is most telling when it comes to the changes in her life, especially what is now her positive net worth. She has more assets. She has begun saving for retirement and has more liquidity, distributed in her chequing, savings, and money market accounts. Since she has less debt as a result of having paid off her student loan, she now has positive net worth.
Comparing the relative results of the common-size statements provides an even deeper view of the relative changes in Brittany’s situation (See the following tables: Table 3.2.11 “Comparing Brittany’s Common-Size Statements for 2016 and 2026: Income Statements,” Table 3.2.12 “Comparing Brittany’s Common-Size Statements for 2016 and 2026: Cash Flow Statements,” and Table 3.2.13 “Comparing Brittany’s Common-Size Statements for 2016 and 2026: Balance Sheets”).
|
For the Year Ending |
12/31/16 |
12/31/26 |
|
Gross wages |
100.00% |
100.00% |
|
Income taxes and deductions |
20.00% |
25.00% |
|
Disposable income |
80.00% |
75.00% |
|
Rent |
24.19% |
24.32% |
|
Food |
8.73% |
5.27% |
|
Car expenses |
8.06% |
4.86% |
|
Clothing |
4.03% |
2.43% |
|
Cell phone |
2.69% |
1.62% |
|
Internet and cable TV |
2.69% |
1.62% |
|
Entertainment, travel, etc. |
6.05% |
7.03% |
|
Total living expenses |
56.44% |
47.16% |
|
Car loan interest |
0.54% |
1.02% |
|
Student loan interest |
9.50% |
0.00% |
|
Total interest expenses |
10.03% |
1.02% |
|
Net income |
13.53% |
26.81% |
|
For the Year Ending |
12/31/16 |
12/31/26 |
|
Cash from gross wages |
100.00% |
100.00% |
|
Cash paid for: |
||
|
Income taxes and deductions |
-20.00% |
-25.00% |
|
Rent |
-24.19% |
-24.32% |
|
Food |
-8.73% |
-5.27% |
|
Car expenses |
-8.06% |
-4.86% |
|
Clothing |
-4.03% |
-2.43% |
|
Cell phone |
-2.69% |
-1.62% |
|
Internet and cable TV |
-2.69% |
-1.62% |
|
Entertainment, travel, etc. |
-6.05% |
-7.03% |
|
Car loan interest |
-0.54% |
-1.02% |
|
Student loan interest |
-9.50% |
0.00% |
|
Operating cash flows |
13.53% |
26.81% |
|
Cash invested in pension |
0.00% |
-4.05% |
|
Cash invested in car |
0.00% |
-8.51% |
|
Investing cash flows |
0.00% |
-12.57% |
|
Repayment of car loan |
-4.84% |
-6.23% |
|
Repayment of student loan |
-7.79% |
0.00% |
|
Financing cash flows |
-12.63% |
-6.23% |
|
Net cash flow |
0.90% |
8.02% |
|
As of |
12/31/16 |
12/31/26 |
|
Assets |
|
|
|
Cash/Chequing |
0.00% |
11.56% |
|
Savings |
4.76% |
0.58% |
|
Money Market |
0.00% |
6.01% |
|
Pension |
0.00% |
30.06% |
|
RRSP |
0.00% |
17.11% |
|
Car |
95.24% |
34.68% |
|
Total assets |
100.00% |
100.00% |
|
Liabilities |
|
|
|
Car loan |
51.43% |
10.66% |
|
Student loan |
1009.52% |
0.00% |
|
Total liabilities |
1006.95% |
10.66% |
|
Net worth |
-960.95% |
89.34% |
Although income taxes and rent have increased as a percentage of income, living expenses have declined, showing Brittany’s real progress in raising her standard of living: it now costs her less of her income to sustain herself. Interest expense has decreased substantially as a portion of income, resulting in a net income or personal profit that is not only larger, but larger relative to income. More of her income is profit, left for other discretionary uses.
The change in operating cash flows confirms this. Although her investing activities now represent a significant use of cash, her need to use cash in financing activities—debt repayment—is so much less that her net cash flow has increased substantially. The cash that used to have to go toward supporting debt obligations now goes toward building an asset base, such as the RRSP, which may provide income in the future.
Changes in the balance sheet show a much more diversified and therefore much less risky asset base. Although almost half of Brittany’s assets are restricted for a specific purpose, such as her RRSP account, she still has significantly more liquidity and more liquid assets. Debt has fallen from ten times the assets’ value to one-tenth of it, creating some ownership for Brittany. Finally, Brittany can compare her ratios over time, as seen in Table 3.2.14.
|
Ratio Analysis |
12/31/16 |
12/31/26 |
|
Net income margin |
0.1353 |
0.2681 |
|
Return on assets |
1.1505 |
0.4588 |
|
Return on net worth |
-0.1197 |
0.5135 |
|
Debt to assets |
10.6095 |
0.1066 |
|
Interest coverage |
1.3482 |
26.2127 |
|
Cash flow to income |
0.0662 |
0.2990 |
|
Cash flow to assets |
0.0762 |
0.1372 |
Most immediately, her net worth is now positive, and so are the return on net worth and the total debt ratios. As her debt has become less significant, her ability to afford it has improved (to pay for its interest and repayment). Both her interest coverage and free cash flow ratios show large increases. Since her net income margin (and income) has grown, the only reason her return-on-asset ratio has decreased is because her assets have grown even faster than her income.
By analyzing over time, you can spot trends that may be happening too slowly or too subtly for you to notice in daily living, but which may become significant over time. It is recommended to review your situation at least every year.
Key Takeaways
- Each financial statement shows a piece of the larger picture. Financial statement analysis puts this information in context and so in sharper focus.
- Common-size statements show the size of each item relative to a common denominator.
- On the income statement, each income and expense is shown as a percentage of total income.
- On the cash flow statement, each cash flow is shown as a percentage of total positive cash flow.
- On the balance sheet, each asset, liability, and net worth is shown as a percentage of total assets.
- The income and cash flow statements explain the changes in the balance sheet over time.
- Ratio analysis is a way of creating a context by comparing items from different statements.
- Comparisons made over time can demonstrate the effects of past decisions to better understand the significance of future decisions.
- Financial statements should be compared at least annually.
Exercises
- Prepare common-size statements for your income statement, cash flow statement, and balance sheet. What do your common-size statements reveal about your financial situation? How will your common-size statements influence your personal financial planning?
- Calculate your debt-to-income ratio and other ratios using the financial tools found in the article on the U.S. News & World Report website “Debt-to-Income Ratio: Are You In Over Your Head?.” According to the calculation, are you carrying a healthy debt load? Why or why not? If not, what can you do to improve your situation?
- Read a 2006 article by Charles Farrell in the Financial Planning Association Journal—“Personal Financial Ratios: An Elegant Roadmap to Financial Health and Retirement”. Farrell focuses on three ratios: savings to income, debt to income, and savings rate to income. Where, how, and why might these ratios appear on the chart of common personal financial ratios in this chapter?
- If you increased your income and assets and reduced your expenses and debt, your personal wealth and liquidity would grow. In your personal financial journal, outline a general plan for how you would use or allocate your growing wealth to further reduce your expenses and debt, to acquire more assets or improve your standard of living, and to further increase your real or potential income.
3.3 ACCOUNTING SOFTWARE: AN OVERVIEW
Learning Objectives
- Identify the uses of personal finance software.
- List the common features of personal financial software.
- Demonstrate how actual financial calculations may be accomplished using personal financial software.
- Discuss how personal financial software can assist in your personal financial decisions.
Many software products are available to help you organize your financial information to be more useful in making financial decisions. They are designed to make the record-keeping aspects of personal finance—the collection, classification, and sorting of financial data—as easy as possible. The programs are also designed to produce summary reports (e.g., income statements, cash flow statements, and balance sheets) as well as many calculations that may be useful for various aspects of financial planning. For example, financial planning software exists for managing education and retirement savings, debt and mortgage repayment, and income and expense budgeting.
Collecting the Data
Most programs have designed their data input to look like a chequebook, which is what most people use to keep personal financial records. This type of user interface is intended to be recognizable and familiar, similar to the manual record keeping that you may already do.
When you input your chequebook data into the program, the software does the bookkeeping, creating the journals, ledgers, adjustments, and trial balances that people have done—albeit more tediously, with parchment and quill or with ledger paper and pencil—for generations. Most personal financial transactions happen as cash flows through a chequing account, so the chequebook becomes the primary source of data.
More and more personal transactions are done by electronic transfer—that is, no paper changes hands, but cash still flows to and from an account, usually a chequing account.
Data for other transactions, such as income from investments or changes in investment value, are usually received from periodic statements issued by investment managers: banks where you have savings accounts; brokers or mutual fund companies that manage investments; or employers’ retirement account statements.
Most personal financial software allows you to download account information directly from the source—your bank, broker, or employer—which saves you from manually entering the data into the program. Aside from providing convenience, downloading directly should eliminate human error in transferring the data.
Reporting Results and Planning Ahead
All personal financial software produces the essential summary reports—the income statement, cash flow statement, and balance sheet—that show the results of financial activity for the period. Most will also report more specific aspects of activities, such as listing all transactions for a particular income or expense.
Most will provide separate reports on activities that have some tax consequence, since users always need to be aware of tax obligations and tax consequences of financial decisions. Some programs, especially those produced by companies that also sell tax software, allow you to export data from your financial software to your tax program, which makes tax preparation—or at least tax record keeping—easier. In some programs, you need to know which activities are taxable and flag them as such. Some programs recognize that information already, while others may still prompt you for tax information.
All programs allow you to play “What If?”; this is a marvelous feature of computing power and the virtual world in general, and certainly helpful when it comes to making financial decisions. All programs include a budgeting feature that allows you to foresee or project possible scenarios and gauge your ability to live with them. This feature is particularly useful when budgeting for income and living expenses. Budgeting is discussed more thoroughly in Chapter 5 “Financial Plans: Budgets.” Most programs have features that allow you to project the results of savings plans for education or retirement. None can dictate the future, or allow you to, but they can certainly help you to have a better view.
Security, Benefits, and Costs
All programs are designed to be installed on a personal computer or a handheld device such as a smart phone, but some can also be run from a website and therefore do not require a download. Product and service providers are very concerned with security.
As with all Internet transactions, you should be aware that the more your data is transferred, downloaded, or exported over the Internet, the more exposed it is to theft. Personal financial data theft is a serious and growing problem worldwide, and security systems are hard pressed to keep up with the ingenuity of hackers. The convenience gained by having your bank, brokerage, tax preparer, and so on, accessible to you (and your data accessible to them), or your data accessible to you wherever you are, must be weighed against the increased exposure to data theft. As always, the potential benefit should be considered against the costs.
Keeping digital records of your finances may be more secure than keeping them scattered in shoeboxes or files, where they are exposed to risks such as fire, flood, and theft. Digital records are often easily retrievable because the software organizes them systematically for you. Space is not a practical issue with digital storage, so records may be kept longer. As with anything digital, however, you must be diligent about backing up your data, although many programs will do that automatically or regularly prompt you to do so. Hard-copy records must be disposed of periodically, and judging how long to keep them is always difficult. Throwing them in the trash may be risky because of “dumpster diving,” a well-known method of identity theft, so documents with financial information should always be shredded before disposal.
Personal financial software is usually quite reasonably priced, with many programs selling for less than $50, and most for less than $100. Buying the software usually costs less than buying an hour of accounting expertise from an accountant or financial planner. While software cannot replace financial planning professionals’ valuable judgment, it can allow you to hire them only for their judgment rather than to collect, classify, sort, and report your financial data.
Software will not improve your financial situation, but it can improve the organization of your financial data monthly and yearly, allowing you a much clearer view and almost certainly a much better understanding of your situation.
Software References
1. Visit thebalance.com and read the article “Best Online Personal Finance Software Apps” for information on how to manage and save money with different apps.
2. Visit the product review website Top Ten Reviews and read the article “Best Personal Finance Software of 2018” to find personal financial software favourites that are reasonably priced.
Key Takeaways
- Personal finance software provides convenience and skill for collecting, classifying, sorting, reporting, and securing financial data to better assess you current situation.
- To help you better evaluate your choices, personal finance software provides calculations for projecting information such as the following:
• Education savings
• Retirement savings
• Debt repayment
• Mortgage repayment
• Income and expense budgeting
Exercises
- Explore free online resources for developing and comparing baseline personal financial statements. One good resource is a blog from Money Musings called “It’s Your Money”. View the post “The Worth of Net Worth.” This site also explains how and where to find the tables you need for accurate and complete income statements and balance sheets.
- Compare and contrast the features of popular personal financial planning software at the following websites: Mint.com, www.quicken.com/canada, and Moneydance.com. Record your findings in your personal finance journal. Which software, if any, would be your first choice, and why? Share your experience and views with others taking this course.
- The Financial Consumer Agency of Canada explains the key components of financial planning in Module 11: Financial planning of its Financial Toolkit. What goes into a financial plan? What aspects of financial planning do you already have in place? What aspects of financial planning should you consider next?

Feedback/Errata