14 Owning Bonds and Investing in Mutual Funds
INTRODUCTION
One definition of a bond is an affinity between people. In science, that affinity is physically held together by an attraction of atoms. In finance, a bond is a debt agreement holding lender and borrower together in a shared financial fate.
Investors buy bonds to participate in economic growth as lenders rather than as shareholders, with less risk and a firmer claim on assets. Bonds are issued by different kinds of organizations—by governments as well as by corporations—giving investors different kinds of partners in growth.
Since bonds are a different form of capital than stocks, and since bond investments are made by different kinds of borrowers, bonds offer diversification from the stocks in your portfolio. Your use of bonds may change over time, as your risk tolerance or liquidity needs change.
Mutual funds are not another kind of asset, but another way of investing in any kind of asset. The fund is a pool capable of much greater diversification than an individual’s investment portfolio, given transaction costs. A mutual fund can also provide security selection, expertise, liquidity, and convenience. Some funds are even designed to perform the asset allocation task for the investor. Mutual funds are fast becoming the dominant investment vehicle for individual investors, changing the role of the broker and financial adviser.
Mutual funds may be purchased by parents and/or grandparents to help provide for their future. Elder Margaret Reynolds said that one reason she and her husband “buy mutual funds and trust funds [is] because I don’t know what it’s going to be like in 20 years for my grandchildren, so those are the things that we do now” (Elder Reynolds, Video 7). Elder Reynolds and her husband look after their grandchildren to make sure that they are cared for in the future. This is good financial planning.
14.1 BONDS AND BOND MARKETS
Learning Objectives
- Identify bond features that can determine risk and return.
- Identify various Canadian federal, provincial, and municipal bonds.
- Compare and contrast features of the corporate bond markets, the markets for corporate stock, and the markets for government bonds.
- Explain the role of rating agencies and the process of bond rating.
Bonds are a relatively old form of financing. Formalized debt arrangements long preceded corporate structure and the idea of equity (stock) as we know it. Venice issued the first known government bonds of the modern era in 1157 (Barmash, 2003), while private bonds are cited in British records going back to the thirteenth century (Adams, 1921).
Bonds
In addition to financing government projects, bonds are used by corporations to capitalize growth. Bonds are also a legal arrangement, and as such are subject to various conditions, obligations, and consequences. As a result of their legal and financial roles, bonds carry a quaint and particular vocabulary. Bonds come in all shapes and sizes to suit the needs of the borrowers and the demands of lenders. Table 14.1.1 lists the descriptive terms for basic bond features.
|
Bond Term |
Meaning |
|
Issuer |
Borrower |
|
Investor |
Lender or Creditor |
|
Principal, Face Value, Par Value |
Amount Borrowed |
|
Coupon Rate |
Interest Rate |
|
Coupon |
Interest Payment |
|
Maturity |
Due Date |
|
Term |
Time until Maturity |
|
Yield to Maturity |
Annualized Return on Bond Investment |
|
Market Value |
Current Price |
The coupon is usually paid to the investor twice yearly. It is calculated as a percentage of the face value—amount borrowed—so that the annual coupon = coupon rate × face value. By convention, each individual bond has a face value of $1,000. A corporation issuing a bond to raise $100 million would have to issue 100,000 individual bonds (100,000,000 divided by 1,000). If those bonds pay a 4 per cent coupon, a bondholder who owns one of those bonds would receive a coupon of $40 per year (1,000 × 4%), or $20 every six months.
The coupon rate of interest on the bond may be fixed or floating and may change. A floating rate is usually based on another interest benchmark, such as the prime rate, a widely recognized benchmark of prevailing interest rates.
A zero-coupon bond has a coupon rate of zero: it pays no interest and repays only the principal at maturity. A “zero” may be attractive to investors, however, because it can be purchased for much less than its face value. A registered coupon bond is registered for principal only and not for interest. A registered bond is issued by the issuing company and is registered in the owner’s name. A bearer bond does not register the bond in the investor’s name (Kapoor et al., 2015). There are deferred coupon bonds (also called split-coupon bonds and issued below par), which pay no interest for a specified period, followed by higher-than-normal interest payments until maturity. There are also step-up bonds that have coupons that increase over time.
The face value—the principal amount borrowed—is paid back at maturity. If the bond is callable, it may be redeemed after a specified date, but before maturity. A borrower typically “calls” its bonds after prevailing interest rates have fallen, making lower-cost debt available. Borrowers can borrow new, cheaper debt and pay off the older, more expensive debt. As an investor (lender), you would be paid back early, which sounds great, but because interest rates have fallen, you would have trouble finding another bond investment that would pay as high a rate of return.
A convertible bond is a corporate bond that may be converted into common equity at maturity or after some specified time. If a bond were converted into stock, the bondholder would become a shareholder, assuming more of the company’s risk.
The bond may be secured by collateral, such as property or equipment, sometimes called a mortgage bond. If unsecured, or secured only by the “full faith and credit” of the borrower (the borrower’s unconditional commitment to pay principal and interest on the debt), the bond is a debenture. In other words, a debenture “is a bond that is backed only by the reputation of the issuing corporation” (Kapoor et al., 2015, p. 366). Most bonds are issued as debentures. The First Nations Finance Authority “is a not-for-profit finance authority formed in 1995 to provide member First Nations with the opportunity to use debentures to access long-term affordable financing. Its primary purpose is to raise long-term private capital at preferred rates for public works, such as roads, water and sewer, and buildings” (Cooper, 2016, p. 171). These debentures are secured through property-taxes or long-term revenue sources (Cooper, 2016).
A bond specifies if the borrower has more than one bond issue outstanding or more than one set of lenders to repay, which establishes the bond’s seniority in relation to previously issued debt. This “pecking order” determines which lenders will be paid back first in case of default on the debt or bankruptcy. Thus, when the borrower does not meet its coupon obligations, investors holding senior debt as opposed to subordinated debt have less risk of default. In case of bankruptcy, senior debt will be paid first and subordinate debt second.
Bonds may also come with covenants or conditions on the borrower. Covenants are usually attached to corporate bonds and require the company to maintain certain performance goals during the term of the loan. Those goals are designed to lower default risk for the lender. Examples of typical covenants are:
- dividend limits,
- debt limits,
- limits on sales of assets, and
- maintenance of certain liquidity ratios or minimum cash balances.
Corporations issue corporate bonds, usually with maturities of ten, twenty, or thirty years. Corporate bonds tend to be the most “customized,” with features such as callability, conversion, and covenants.
The Canadian government issues two types of bonds: marketable bonds and T-Bills.
Canada Treasury bills, also known as T-Bills, are investments fully guaranteed by the Government of Canada, which means the principal and rate of interest are guaranteed. T-Bills are considered the safest Canadian investment you can hold with a term of one year or less. They are offered for terms of one month to one year. Interest is paid at maturity. T-Bills can be purchased from most financial institutions and can be sold at market value at any time. The minimum investment for a T-Bill having a term of three months to one year is $5,000. The minimum investment for a T-Bill having a term of one or two months is $25,000 (Canadian Bank Rates, 2013).
Marketable bonds not only have a specific maturity date and interest rate, but they are also transferable and can thus be traded in the bond market. All Canadian-dollar marketable bonds are non-callable, which means they cannot be called in by the government to be redeemed before maturity. Marketable bonds also pay a fixed rate of interest semi-annually (Kapoor et al., 2015).
Real Return Bonds are Canadian government bonds that pay a fixed rate of interest semi-annually that is adjusted by inflation. This ensures your purchasing power remains constant regardless of the future inflation rate.
The sale of Canada Savings Bonds ended November 1, 2017. It was the third type of bond issued by the Canadian government.
Provincial and municipal governments issue bonds in order to raise funds for program spending and to fund deficits. Provincial bonds or debentures are primarily used by provincial governments and are secured by the province through its ability to levy taxes. A general obligation bond is a bond backed by a municipal government. Canadian municipalities often issue two forms of general obligation debt: the serial bond, in which the principal and interest mature on different dates or are paid in installments; and the bullet bond, in which the entire principal is repaid on the bond’s maturity date while regular interest payments are made on the investors’ shares during the term of the fund (Hanniman, 2015). Municipal bullet bonds are often offset by sinking funds “to which annual or semi-annual deposits are made for the purpose of redeeming a bond issue” (Kapoor et al., 2015, p. 368). A revenue bond is repaid out of the revenue generated by the project that the debt is financing. For example, toll revenue may secure a debt that finances a highway. Revenue bonds are not common in Canada and are currently only used in Toronto (Hanniman, 2015).
Foreign corporations and governments also issue bonds. You should keep in mind, however, that foreign government defaults are not uncommon. Mexico in 1994, Russia in 1998, and Argentina in 2001 are all recent examples. Foreign corporate or sovereign debt also exposes the bondholder to currency risk, as coupons and principal will be paid in the foreign currency.
Bond Markets
The volume of capital traded in the bond markets is far greater than what is traded in the stock markets. All sorts of borrowers issue bonds: corporations; national, provincial, and municipal governments. Even small towns issue bonds to finance capital expenditures such as schools, fire stations, and roads. Each kind of bond has its own market.
Private placement refers to bonds that are issued in a private sale rather than through the public markets. The investors in privately placed bonds are institutional investors such as insurance companies, endowments, and pension funds.
Corporate bonds are traded in over-the-counter transactions through brokers and dealers. Because the details of each bond issue may vary—maturity, coupon rate, callability, convertibility, covenants, and so on—it is hard to directly compare bond values the way stock values are compared. As a result, the corporate bond markets are less transparent to the individual investor.
To provide guidance, rating agencies provide bond ratings; that is, they “grade” individual bond issues based on the likelihood of default and thus the risk to the investor. Rating agencies are comprised of independent agents that base their ratings on the financial stability of the company, its business strategy, competitive environment, and its outlook for the industry and the economy—any factors that may affect the company’s ability to meet coupon obligations and pay back debt at maturity.
Ratings agencies such as DBRS, Fitch Ratings, A. M. Best, Moody’s, and Standard & Poor’s are hired by large borrowers to analyze the company and rate its debt. Moody’s also rates government debt. Ratings agencies use an alphabetical system to grade bonds (shown in Table 14.1.2) based on the highest-to-lowest rankings of two well-known agencies.
|
Standard & Poor’s |
Moody’s |
Grade |
Meaning |
|
AAA |
Aaa |
Investment |
Risk is almost zero |
|
AA |
Aa |
Investment |
Low risk |
|
A |
A |
Investment |
Risk if economy declines |
|
BBB |
Baa |
Investment |
Some risk; more if economy declines |
|
BB |
Ba |
Speculative |
Risky |
|
B |
B |
Speculative |
Risky; expected to get worse |
|
CCC |
Caa |
Speculative |
Probable bankruptcy |
|
C |
Ca |
Speculative |
Probable bankruptcy |
|
C |
C |
Speculative |
In bankruptcy or default |
|
D |
|
Speculative |
In bankruptcy or default |
A plus sign (+) following a rating indicates that it is likely to be upgraded, while a minus sign (−) following a rating indicates that it is likely to be downgraded.
Bonds rated BBB or Baa and above are considered investment grade bonds: relatively low risk and “safe” for both individual and institutional investors. Bonds rated below BBB or Baa are speculative in that they carry some default risk. These are called speculative grade bonds, junk bonds, or high-yield bonds. Because they are riskier, speculative grade bonds need to offer investors a higher return or yield in order to be “priced to sell.”
Although the term “junk bonds” sounds derogatory, not all speculative grade bonds are “worthless” or are issued by “bad” companies. Bonds may receive a speculative rating if their issuers are young companies, in a highly competitive market, or capital intensive, requiring lots of operating capital. Any of those features would make it harder for a company to meet its bond obligations, thus earning its bonds a speculative rating. In the 1980s, for example, companies such as CNN and MCI Communications issued high-yield bonds, which became lucrative investments as the companies grew into successful corporations.
Default risk is the risk that a company won’t have enough cash to meet its interest payments and principal payment at maturity. That risk depends, in turn, on the company’s ability to generate cash, profit, and grow to remain competitive. Bond-rating agencies analyze an issuer’s default risk by studying its economic, industry, and firm-specific environments in order to estimate its current and future ability to satisfy its debts. The default risk analysis is similar to equity analysis, but bondholders are more concerned with cash flows—cash to pay back the bondholders—and profits, rather than profits alone.
Bond ratings can determine the coupon rate the issuer must offer investors to compensate them for default risk: the higher the risk, the higher the coupon must be. Ratings agencies have been criticized recently for not being objective enough in their ratings of the corporations that hire them. Nevertheless, over the years, bond ratings have proven to be a reliable guide for bond investors.
Key Takeaways
- Bond features that can determine risk and return include:
• coupon and coupon structure,
• maturity, callablility, and convertibility,
• security or debenture,
• seniority or subordination, and
• covenants. - Provincial and municipal governments issue
• revenue bonds secured by project revenues, or
• general obligation bonds secured by the government issuer. - Corporate bonds may be issued through the public bond markets or through private placement.
- The secondary bond market offers little transparency because of the differences among bonds and the lower volume of trades.
- To help provide transparency, rating agencies analyze default risk and rate specific bonds.
REFERENCES
Adams, G. B. (1921). The Constitutional History of England. London: H. Holt.
Barmash, I. (2003). The Self-Made Man. Washington, DC: Beard Books.
Canadian Bank Rates. (2013). “Government of Canada Treasury Bill.” Retrieved from http://canadianbankrates.ca/treasurybillrates.php.
Cooper, T. (2016). “Finance and Banking.” In K. Brown, M. Doucette, and J. Tulk, eds., Indigenous Business in Canada, pp.161–176. Sydney, NS: Cape Breton University Press.
Hanniman, K. (2015). “A Good Crisis: Canadian Municipal Credit Conditions After the Lehman Brothers Bankruptcy.” Institute on Municipal Finance & Governance, no. 22. Retrieved from: https://munkschool.utoronto.ca/imfg/uploads/326/1710_imfg_no_22_online_sept_17.pdf.
Kapoor, J., L. Dlabay, R. Hughes, and F. Ahmad. (2015). Personal Finance. Toronto: McGraw-Hill Ryerson.
14.2 BOND VALUE
Learning Objectives
- Explain how bond returns are measured.
- Define and describe the relationships between interest rates, bond yields, and bond prices.
- Define and describe the risks that bond investors are exposed to.
- Explain the implications of the three types of yield curves.
- Assess the role of the yield curve in bond investing.
Bond rating does not replace bond analysis, which focuses on bond value. Like any investment, a bond is worth the value of its expected return. That value depends on the amount expected and the certainty of that expectation. To understand bond values, then, is to understand the value of its return and the costs of its risks.
Bonds return two cash flows to their investors: 1) the coupon, or the interest paid at regular intervals, usually twice yearly or yearly, and 2) the repayment of the principal at maturity. The amounts are spelled out in the bond itself. The coupon rate is specified (for a fixed-rate bond) and the face value is the principal to be returned at the stated maturity.
Unlike a stock, for which the cash flows—both the amount and the timing—are “to be determined,” in a bond everything about the cash flows is established at the outset. Any bond feature that makes those cash flows less certain increases the risk to the investor and thus the investor’s return. If the bond has a floating-rate coupon, for example, then there is uncertainty about the amount of the coupon payments. If the bond is callable, there is uncertainty about the number of coupon payments.
Whatever the particular features of a bond, as debt instruments, bonds expose investors to specific risks. What are those risks, and what is their role in defining expectations of returns?
Bond Returns
Unlike a stock, a bond’s future cash returns are known with certainty. You know what the coupon will be (for a fixed-rate bond) and you know that at maturity the bond will return its face value. For example, if a bond pays a 4 per cent coupon and matures in 2028, you know that every year you will receive $20 twice per year (20 = 4% × 1,000 × ½) until 2028, when you will also receive the $1,000 face value at maturity. You know what you will get and when you will get it. However, you can’t be sure what that will be worth to you when you do. You don’t know what your opportunity cost will be at the time.
Investment returns are quoted as an annual percentage of the amount invested, the rate of return. For a bond, that rate is the yield. Yield is expressed in two ways: the current yield and the yield to maturity. The current yield is a measure of your bond’s rate of return in the short term, if you buy the bond today and keep it for one year. You can calculate the current yield by looking at the coupon for the year as a percentage of your investment or the current price, which is the market price of the bond.
current yield = annual coupon (interest received, or cash flows) / market value =
(coupon rate × face value) / market value
So, if you bought a 4 per cent coupon bond, which is selling for $960 today (its market value), and kept it for one year, the current yield would be 40 (annual coupon) / 960 (market value) = 4.1667%. The idea of the current yield is to give you a quick look at your immediate returns (your return for the next year).
In contrast, the yield to maturity (YTM) is a measure of your return if you bought the bond and held it until maturity, waiting to claim the face value. That calculation is a bit more complicated, because it involves the relationship between time and value (as we saw in Chapter 4 “Evaluating Choices: Time, Risk, and Value”), since the yield is over the long term until the bond matures. You will find bond yield-to-maturity calculators online, and many financial calculators have the formulas preprogrammed.
To continue the example, if you buy a bond for $960 today (2018), you will get $20 every six months until 2028, when you will also get $1,000. Because you are buying the bond for less than its face value, your return will include all the coupon payments ($400 over ten years) plus a gain of $40 (1,000 − 960 = 40). Over the time until maturity, the bond returns coupons plus a gain. Its yield to maturity is close to 4.5 per cent.
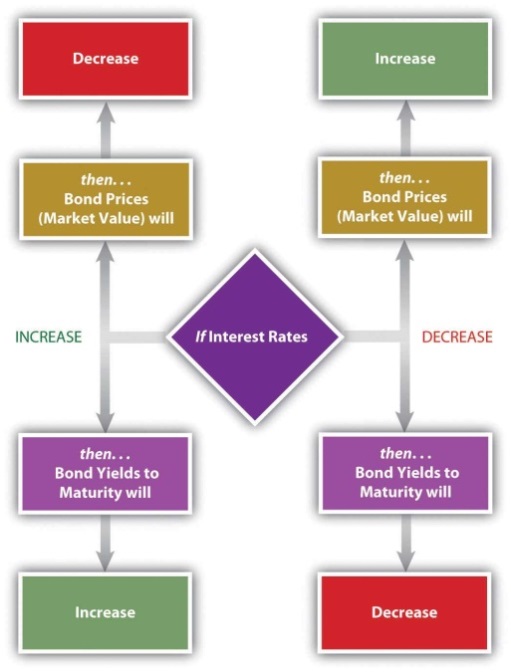
Bond prices—their market values—have an inverse relationship to the yield to maturity. As the price goes down, the yield goes up, and as the price goes up, the yield goes down.
The yield to maturity is directly related to interest rates in general, so as interest rates increase, bond yields increase and bond prices fall. As interest rates fall, bond yields fall and bond prices increase. Chart 14.2.1 shows these relationships.
Chart 14.2.1 Bond Prices, Bond Yields, and Interest Rates
You can use the yield to maturity to compare bonds to see how good they are at creating returns. This yield holds if you hold the bond until maturity, but you may sell the bond at any time. When you sell the bond before maturity, you may have a gain or a loss, since the market value of the bond may have increased or decreased since you bought it. That gain or loss would be part of your return along with the coupons you have received over the holding period, or the period of time that you held the bond.
Your holding period yield is the annualized rate of return that you receive depending on how long you have held the bond, its gain or loss in market value, and the coupons you received in that period. For example, if you bought the bond for $960 and sold it again for $980 after two years, your return in dollars would be the coupons of $80 ($40 per year × 2 years) plus your gain of $20 ($980 − $960), relative to your original investment of $960. Your holding period yield would be close to 5.2 per cent.
Bond Risks
The basic risk of bond investing is that the returns—the coupon and the principal repayment (face value)—will not be repaid, or that when they are repaid, they won’t be worth as much as you thought they would be. The risk that the company will be unable to make its payments is default risk—the risk that it will default on the bond. You can estimate default risk by looking at the bond rating as well as the economic and sector- and firm-specific factors that define the company’s soundness.
Part of a bond’s value is that you can expect regular coupon payments in cash, which you could spend or reinvest. There is a risk, however, that when you go to reinvest the coupon, you will not find another investment opportunity that will pay as high a return because interest rates and yields have fallen. This is called reinvestment risk. Your coupons are the amount you thought they would be, but they are not worth as much as you expected because you cannot earn as much from them.
If interest rates and bond yields have dropped, your fixed-rate bond, which is paying a coupon that is now higher than other bonds, has become more valuable. Its market price has risen. But the only way to realize the gain from the higher price is to sell the bond, and then you won’t have any place to invest the proceeds in other bonds to earn as much return.
Reinvestment risk is one facet of interest rate risk, which arises from the fundamental relationship between bond values and interest rates. Interest rate risk is the risk that a change in prevailing interest rates will change bond value—that interest rates will rise and the market value of the bond will fall. (If interest rates fell, the bond value would increase, which the investor would not see as a risk.)
Another threat to the value of your coupons and principal repayment is inflation. Inflation risk is the risk that your coupons and principal repayment will not be worth as much as you thought, because inflation has decreased the purchasing power or the value of the dollars you receive.
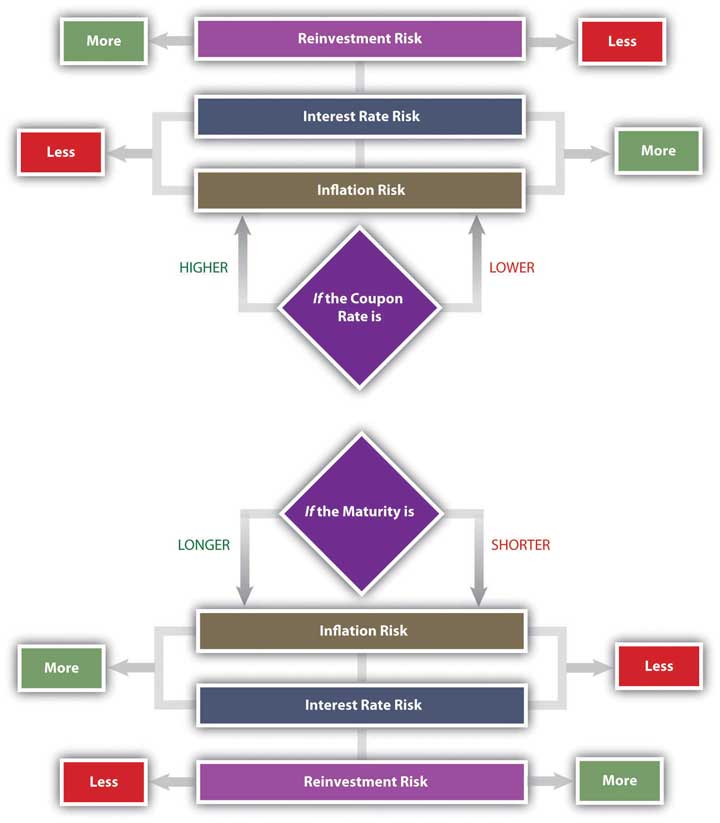
A bond’s features can make it more or less vulnerable to these risks. In general, the longer the term to maturity, the riskier the bond. The longer the term is, the greater the probability that the bond will be affected by a change in interest rates, a period of inflation, or a damaging business cycle.
In general, the lower the coupon rate and the smaller the coupon, the more sensitive the bond will be to a change in interest rates. The lower the coupon rate and the smaller the coupon, the more of the bond’s return comes from the repayment of principal, which only happens at maturity. More of your return is deferred until maturity, which also makes it more sensitive to interest rate risk. A bond with a larger coupon provides more liquidity, over the term of the bond, and less exposure to risk. Chart 14.2.2 shows the relationship between bond characteristics and risks.
Chart 14.2.2 Bond Characteristics and Risks
A zero-coupon bond offers the lowest coupon rate possible: zero. Investors avoid reinvestment risk since the only return—and reinvestment opportunity—comes when the principal is returned at maturity. However, a “zero” is exposed to the maximum interest rate risk, because interest rates will always be higher than its coupon rate of zero. The attraction of a zero is that it can be bought for a very low price.
As a bond investor, you can make better decisions if you understand how the characteristics of bonds affect their risks and yields as you use those yields to compare and choose bonds.
Yield Curve
Interest rates affect bond risks and bond returns. If you plan to hold a bond until maturity, interest rates also affect reinvestment risk. If you plan to sell the bond before maturity, you face interest rate risk or the risk of a loss of market value. When you invest in bonds, then, you want to be able to forecast future interest rates.
Investors can get a sense of how interest rates are expected to change in the future by studying the yield curve, a graph that compares the terms of the yields for bonds of different maturities.
The yield curve illustrates the term structure of interest rates, or the relationship of interest rates to time. Usually, the yield curve is upward sloping—that is, long-term rates are higher than short-term rates. Long-term rates indicate expected future rates. If the economy is expanding, future interest rates are expected to be higher than current interest rates, because capital is expected to be more productive in the future. Future interest rates will also be higher if there is inflation because lenders will want more interest to make up for the fact that the currency has lost some of its purchasing power.
A flat yield curve indicates that future interest rates are expected to be about the same as current interest rates or that capital will be about as productive in the economy as it is now. A downward-sloping yield curve shows that future interest rates are expected to be lower than current rates. This is often interpreted as a signal of a recession, because capital would be less productive in the future if the economy were less productive then.
The yield curve is not perfectly smooth; it changes every day as bonds trade and new prices and new yields are established in the bond markets. It is a widely used indicator of interest rate trends, however. It can be useful to know the broad trends in interest rates that the market sees.
For your bond investments, an upward-sloping yield curve indicates that interest rates will go up, which means that bond yields will go up but bond prices will go down. If you are planning to sell your bond in that period of rising interest rates, you may be selling at a loss.
Because of their known coupon and face value, many investors use bonds to invest funds for a specific purpose. For example, suppose you have a child who is eight years old and you want her to be able to go to university in ten years. You might invest in bonds that have ten years until maturity. However, if you invest in bonds that have twenty years until maturity, they will have a higher yield (all else being equal), so you could invest less now.
You could buy the twenty-year bonds but plan to sell them before maturity for a price determined by what interest rates are in ten years (when you sell them). If the yield curve indicates that interest rates will rise over the next ten years, then you could expect your bond price to fall, and you would have a loss when you sell the bond, which would take away from your returns.
In general, rising interest rates mean losses for bondholders who sell before maturity, and falling interest rates mean gains for bondholders who sell before maturity. Unless you are planning to hold bonds until maturity, the yield curve can give you a sense of whether you are more likely to have a gain or loss.
Key Takeaways
- All bonds expose investors to:
• default risk (the risk that coupon and principal payments won’t be made),
• reinvestment risk (the risk that coupon payments will be reinvested at lower rates),
• interest rate risk (the risk that changing interest rates will affect bond values), and
• inflation risk (the risk that inflation will devalue bond coupons and principal repayment). - Bond returns can be measured by yields.
• The current yield measures short-term return on investment.
• The yield to maturity measures return on investment until maturity.
• The holding period yield measures return on investment over the term that the bond is held. - There is a direct relationship between interest rates and bond yields.
- There is an inverse relationship between bond yields and bond prices (market values).
- There is an inverse relationship between bond prices (market values) and interest rates.
- The yield curve illustrates the term structure of interest rates, showing yields of bonds with differing maturities and the same default risk. The purpose of a yield curve is to show expectations of future interest rates.
- The yield curve may be:
• upward sloping, indicating higher future interest rates;
• flat, indicating similar future interest rates; or
• downward sloping, indicating lower future interest rates.
Exercises
- How do you buy bonds? Read Investopedia’s primer “Bond Basics: How to Trade Bonds.”
- Read Investopedia’s explanation of how to read a bond table, “Bond Basics: How To Read A Bond Table.” In the example of a bond table, suppose you invested $5,000 in Avco’s bond issue. What coupon rate were you getting? When was the maturity date, and how much did you get then? What was the current value of the bond at that time? What does it mean for a bond to be trading above par? What was the bond’s annual return during the time you held it? If you held the bond for ten years, what cash flows did you receive? Would you have reinvested in the bond when it matured, or would you have sold it and why? Study the other corporate bonds listed in the Investopedia example of a bond table.
- To find out more about how to use bond tables when making investment decisions, read the article “Reading Bond Prices in the Newspaper” by the Securities Industry and Financial Markets Association. Where will you find bond tables? What will you compare in bond tables? At the top of this Securities Industry and Financial Markets Association page, click on one of the bond markets “at-a-glance” under “Bond Markets & Prices.” Then enter the name of an issuer on the form and choose the data you want to see. For example, enter your province’s name and ask to see all the bonds by yield or by maturity date or by some other search factor. What do these data tell you? For each search factor, how would the information assist you in making decisions about including bonds in your investment portfolio?
- Experiment with Investopedia’s Yield to Maturity calculator. Why should you know the yield to maturity (indicated as “YTM” on the calculator) before investing in bonds?
14.3 BOND STRATEGIES
Learning Objectives
- Discuss diversification as a strategic use of bonds.
- Summarize strategies to achieve bond diversification.
- Define and compare matching strategies.
- Explain life cycle investing and bond strategy.
Bonds provide more secure income for an investment portfolio, while stocks provide more growth potential. When you include bonds in your portfolio, you do so to have more income and less risk than you would have with just stocks. Bonds also diversify the portfolio. Because debt is so fundamentally different from equity, debt markets and equity markets respond differently to changing economic conditions.
Diversification Strategies
If your main strategic goal of including bonds is diversification, you can choose an active or passive bond selection strategy. As with equities, an active strategy requires individual bond selection, while a passive strategy involves the use of indexing, or investing through a broadly diversified bond index fund or mutual fund in which bonds have already been selected.
The advantage of the passive strategy is its greater diversification and relatively low cost. The advantage of an active strategy is the chance to create gains by finding and taking advantage of market mispricings. An active strategy is difficult for individual investors in bonds, however, because the bond market is less transparent and less liquid (this applies mostly to corporate bonds, not government bonds) than the stock market.
If your main strategic goal of including bonds is to lower the risk of your portfolio, you should keep in mind that bond risk varies.
Another way to look at the effect of default risk on bond prices is to look at spreads. A spread is the difference between one rate and another. With bonds, the spread generally refers to the difference between one yield to maturity and another. Spreads are measured and quoted in basis points. A basis point is one one-hundredth of a per cent, or 0.0001 or 0.01 per cent.
The most commonly quoted spread is the difference between the yield to maturity for a Treasury bond and a corporate bond with the same term to maturity. Treasury bonds are considered to have no default risk because it is unlikely that the Canadian government will default. Treasuries are exposed to reinvestment, interest rate, and inflation risks, however.
Corporate bonds are exposed to all four types of risk. So, the difference between a twenty-year corporate bond and a twenty-year Treasury bond is the difference between a bond with and without default risk. The difference between their yields—the spread—is the additional yield for the investor for taking on default risk. The riskier the corporate bond, the greater the spread.
Spreads generally fluctuate with market trends and with confidence in the economy or expectations of economic cycles. When spreads narrow, the yields on corporate bonds are closer to the yields on Treasury bonds, indicating that there is less concern with default risk. When spreads widen, corporate bondholders worry more about default risk.
As the spread widens, corporate yields rise and/or Treasury yields fall. This means that corporate bond prices (market values) are falling and/or Treasury bond values are rising. This is sometimes referred to as the “flight to quality.” In uncertain times, investors would rather invest in Treasuries than corporate bonds, because of the increased default risk of corporate bonds. As a result, Treasury prices rise (and yields fall) and corporate prices fall (and yields rise).
Longer-term bonds are more exposed to reinvestment, interest rate, and inflation risk than shorter-term bonds. If you are using bonds to achieve diversification, you want to be sure to be diversified among bond maturities. For example, you would want to have some short-term (less than one year until maturity), intermediate-term (two to ten years until maturity), and long-term (more than ten years until maturity) bonds, in addition to diversifying on the basis of industries and company and perhaps even countries.
Matching Strategies
Matching strategies are used to create a bond portfolio that will finance specific funding needs, such as education, a down payment on a second home, or retirement. If the timing and cash flow amounts of these needs can be predicted, then a matching strategy can be used to support them. This strategy involves matching a “liability” (to yourself, because you “owe” yourself the chance to reach that goal) with an “asset” (a bond investment). The two most commonly used matching strategies are immunization and cash flow matching.
Immunization is designing a bond portfolio that will achieve a certain rate of return over a specific period of time, based on the idea of balancing interest rate risk and reinvestment risk.
Recall that as interest rates rise, bond values decrease, but reinvested income from bond coupons earns more. As interest rates fall, bond values increase, but reinvested income from bond coupons decreases. Immunization is the idea of choosing a portfolio of bonds such that the exposure to interest rate risk is exactly offset by the exposure to reinvestment risk for a certain period of time, thus guaranteeing a minimum return over that period (Maginn, Tuttle, Pinto, and McLeavey, 2007).
In other words, the interest rate risk and the reinvestment risk cancel each other out, and the investor is left with a guaranteed return. You would use this kind of strategy when you had a liquidity need with a deadline—for example, to fund a child’s higher education.
Cash flow matching, also called a dedication strategy, is an alternative to immunization. It involves choosing bonds that match your anticipated cash flow needs by having maturities that coincide with the timing of those needs. For example, if you will need $50,000 for travel in twenty years, you could buy bonds with a face value of $50,000 and a maturity of twenty years. If you hold the bonds to maturity, their face value provides the amount of cash flow you need, and you don’t have to worry about interest rate or reinvestment risk. You can plan on having $50,000 in twenty years, barring any default.
If you had the $50,000 now, you could just stuff it under your mattress or save it in a savings account. But buying a bond has two advantages: 1) you may be able to buy the bond for less than $50,000 now, requiring less upfront investment; and 2) over the next twenty years, the bond will also pay coupons at a higher rate than you could earn with a savings account or under your mattress.
If you will need different cash flows at different times, you can use cash flow matching for each one. When cash flow matching is used to create a steady stream of regular cash flows, it is called bond laddering. You invest in bonds of different maturities, such that you would have one bond maturing and providing cash flow in each period (like the GIC laddering discussed in Chapter 7 “Financial Management”).
Strategies such as immunization and cash flow matching are designed to manage interest rate and reinvestment risk to minimize their effects on your portfolio’s goals. Since you are pursuing an active strategy by selecting individual bonds, you must also consider transaction costs and the tax consequences of your gain (or loss) at maturity and their effects on your target cash flows.
Life Cycle Investing
Bonds are most commonly used to reduce portfolio risk. Typically, as your risk tolerance decreases with age, you will include more bonds in your portfolio, shifting its weight from stocks, which have more growth potential, to bonds, which have more income and less risk. This change in the weighting of portfolio assets usually begins as you get closer to retirement.
For years, the conventional wisdom was that you should have the same percentage of your portfolio invested in bonds as your age, so that you have 30 per cent of your portfolio in bonds when you are thirty, 50 per cent when you are fifty, and so on. That wisdom is now being questioned, however, because while bonds are lower risk, they also have lower growth potential. Today, since more people can expect to live much longer past retirement age, they run a real risk of outliving their funds if they invest as conservatively as the conventional wisdom suggests.
It is still true nevertheless that for most people, risk tolerance changes with age, and your investment in bonds should reflect that change.
Key Takeaways
- One strategic use of bonds in a portfolio is to increase diversification.
- Diversification can be achieved by: an active strategy, using individual bond selection; or a passive strategy, using indexing.
- Spreads indicate the “price” or the yield on default risk.
- Matching strategies to minimize interest rate and reinvestment risks can include: immunization, cash flow matching, and bond laddering.
- Life cycle investing considers the relationship of age and risk tolerance to the strategic use of bonds in a portfolio.
Exercises
In your personal finance journal, record your bond strategy. What will be your purpose in including bonds in your portfolio? What types of bonds will you include and why? Will you take an active or passive approach and why? How will spreads inform your investment decisions? Which bond strategies described in this section will you plan to use and why? How will your bond strategies reflect your needs to diversify, reduce risk, and maximize liquidity at the right times? How will your bond strategies reflect your age and risk tolerance?
REFERENCES
Maginn, J. L., D. Tuttle, J. Pinto., and D. McLeavey. (2007). Managing Investment Portfolios: A Dynamic Process, 3rd ed. Charlottesville, VA: CFA Institute.
14.4 MUTUAL FUNDS
Learning Objectives
- Identify the general purposes of using mutual funds in individual investment portfolios.
- Analyze the advantages of an index fund or a fund of funds.
- List and define the structures of mutual funds.
- Describe the strategic goals of lifestyle funds, leveraged funds, and inverse funds.
- Identify the costs and differences in costs of mutual fund investing.
- Calculate returns from mutual fund investing.
- Summarize the information found in a mutual fund prospectus.
As defined in the Chapter 12 “Investing,” a mutual fund is a portfolio of securities consisting of one type of security or a combination of several different types. A fund serves as a convenient way for an investor to have a diversified portfolio of investments in just about any investable asset. The oldest mutual fund is believed to have been founded by Adriaan van Ketwich in 1774. Ketwich invited investors to contribute to a trust fund to spread the risk of investing in foreign bonds. The idea moved from the Netherlands to Scotland to the United States, where the Boston Personal Property Trust established the first mutual fund in 1893 (Investment Funds Institute of Canada, 2017).
Mutual funds play a significant role in individual investment decisions. A mutual fund provides an investor with cheaper and simpler diversification and security selection, requiring only one transaction to own a diversified portfolio (the mutual fund). By buying shares in the fund rather than individual securities, you achieve extensive diversification for a much lower transaction cost than by investing in individual securities and making individual transactions. You also receive the benefit of professional security selection, which theoretically minimizes the opportunity costs of lesser choices. So, by using a mutual fund, you get more and better security selection and diversification.
A mutual fund also provides stock and bond issuers with a mass market. Rather than selling shares to investors individually (and incurring the costs of doing so), issuers can more easily find a market for their shares in mutual funds.
Structures and Types of Mutual Funds
Like stocks and bonds, mutual funds may be actively or passively managed. As you read in Chapter 13 “Owning Stocks” and Chapter 14 “Owning Bonds and Investing in Mutual Funds,” actively managed funds provide investors with professional management and the expected research, analysis, and watchfulness that goes with it. Passively managed index funds, on the other hand, are designed to mirror the performance of a specific index constructed to be representative of an asset class.
Mutual funds are structured in three ways:
- Closed-end funds
- Open-end funds
- Exchange-traded funds
Closed-end funds are funds for which a limited number of shares are issued. Once all shares have been issued, the fund is “closed” so a new investor can only buy shares from an existing investor. Since the shares are traded on an exchange, the limited supply of shares and the demand for them in that market directly determines the value of the shares for a closed-end fund.
Most mutual funds are open-end funds in which investors buy shares directly from the fund and redeem or sell shares back to the fund. The price of a share is its net asset value (NAV), or the market value of each share as determined by the fund’s assets and liabilities and the number of shares that exist. Here is the basic formula for calculating NAV:
NAV = (market value of fund securities − fund liabilities)
number of shares outstanding
Demand for shares is reflected in the number of shares outstanding, because the fund can create new shares for new investors. NAV calculations are usually done once per day at the close of trading, when mutual fund transactions are recorded.
The NAV is the price that the fund will pay you when you redeem your shares, so it is a gauge of the shares’ value. It will increase if the market value of the securities in the fund increases faster than the number of new shares.
Exchange-traded funds (ETFs) are structured like closed-end funds, but are traded like stocks. Shares are traded and priced continuously throughout the day’s trading session, rather than once per day at the end of trading. ETFs trade more like individual securities; that is, if you are trying to time a market, they are a nimbler asset to trade than open- or closed-end funds.
Originally designed as index funds, exchange-traded funds now target just about every asset, sector, and economic region imaginable.
Table 14.4.1 compares the features of closed-end funds, open-end funds, and ETFs.
|
|
Closed-End |
Open-End |
ETF |
|
Number of Shares |
Limited |
Unlimited |
Limited |
|
Trades |
End of the trading day |
Fund sponsor |
Continuously |
|
Traded with |
Other shareholders (after the fund closes) |
End of the trading day |
Other shareholders |
Shares of closed-end funds and exchange-traded funds are bought and sold on exchanges, much like shares of stock. You would go through a broker to make those transactions. Shares of open-end funds may be bought and sold directly from the fund sponsor, a mutual fund company, or investment manager. You can make those transactions at any of the company’s offices, by telephone, or online. About 40 per cent of all mutual fund transactions are done directly (without a broker) through a retirement plan contribution or a mutual fund company (The Investment Company Institute, 2009).
Some other types of mutual funds are shown in Table 14.4.2. Some research companies, such as Morningstar, track as many as forty-eight different categories of mutual funds.
|
Mutual Funds |
Definition |
|
Funds of funds |
Mutual funds that own shares in other mutual funds rather than in specific securities. If you decide to use mutual funds rather than select securities, a fund of funds will provide expertise in choosing funds. Funds of stocks and bonds that manage portfolio risk based on age or the time horizon for liquidity needs. |
|
Lifestyle funds |
Lifestyle funds perform both security selection and asset allocation for investors, determined by the target date. For example, if you were now thirty years old, you might choose a lifestyle fund with a target date of thirty-five years from now for your retirement savings. As the fund approaches its target date, its allocation of investments in stocks and bonds will shift to carry less risk as the target nears. Lifestyle funds are used primarily in saving for retirement; many are created as funds of funds. |
|
Leveraged funds |
Funds that invest both investors’ money and money that the fund borrows to augment the investable assets and thus potential returns. Because they use borrowing, leveraged funds are riskier than funds that do not use leverage. |
|
Inverse funds |
Funds that aim to increase in value when the market declines, to be countercyclical to index funds, which aim to increase in value when the market rises. Inverse funds, also called “bear funds,” are set up to perform contrary to the index. Since most economies become more productive over time, however, you can expect indexes to rise over time, so an inverse fund would make sense only as a very short-term investment. |
Mutual Fund Fees and Returns
All funds must disclose their fees to potential investors: sales fees, management fees, and expenses. A load fund charges a sales commission on each share purchase. That sales charge (also called a front-end load) is a percentage of the purchase price. A no-load fund, in contrast, does not charge a sales commission, because shares may be purchased directly from the fund or through a discount broker. The front-end load can be as much as 8.5 per cent, so if you plan to invest often or in large amounts, that can be a substantial charge. For example, a $5,000 investment may cost you $425, reducing the amount you have to invest and earn a return.
A fund may charge a back-end load, actually a deferred sales charge, paid when you sell your shares instead of when you buy them. The charge may be phased out if you own the shares for a specified length of time, however, usually five to seven years.
A fund may charge a management fee on an annual basis. The management fee is stated as a fixed percentage of the fund’s asset value per share. Management fees can range from 0.1 per cent to 2.0 per cent annually. Typically, a more actively managed fund can be expected to charge a higher management fee, while a passively managed fund such as an index fund should charge a minimal management fee.
A fund may charge an annual distribution fee, also calculated as not more than 1.0 per cent per year of the fund’s asset value. Some mutual funds charge other extra fees as well, passing on fund expenses to shareholders. You should consider fee structure and rate when choosing mutual funds, and this can be done through calculations of the expense ratio.
Taken together, the annual management, distribution, and expense fees are measured by the management expense ratio (MER)—the total annual fees expressed as a percentage of your total investment. MER costs “are deducted before the fund’s performance returns are calculated” (Kapoor et al., 2015, p. 356). Therefore, if your return is 15 per cent and your MER is 2 per cent, you will receive a return of 13 per cent. That may not sound like much, but it means that if the fund earns a 5 per cent return, your net return may be less than 3 per cent (and after taxes, it’s even less). When choosing a fund, you should be aware of all charges—especially annual or ongoing charges—that can affect your investment return.
Owning shares of a mutual fund means owning shares in a pool of assets. The returns of the fund are the returns of those assets: interest, dividends, or gains (losses). Income may come from interest distribution if the fund invests in bonds or interest-producing assets or as dividend distribution if the fund invests in stocks.
Mutual funds buy and sell or “turn over” the fund assets. Even passively managed funds need to rebalance to keep pace with their benchmarks as market values change. The turnover ratio is the percentage of fund assets that have been turned over or replaced in the past year, a measure of the fund’s trading activity.
Turnover can create capital gains or losses. Periodically, usually once per year, the fund’s net capital gains (or losses) are distributed on a per share basis as a capital gains distribution. You would expect turnover to produce more gains than losses. The more turnover, or the higher the turnover ratio, the greater the capital gains distributions you may expect.
Unless you have invested in a tax-exempt savings plan such as an RRSP, interest and dividend distributions are taxable as personal income, as are capital gains, including capital gains distributions. A higher turnover ratio may mean a higher tax expense for capital gains distributions. Most open-end mutual funds allow you the option of having your income and gains distributions automatically reinvested rather than paid out, which means that you may be paying taxes on earnings without ever “seeing” the money.
Mutual Fund Information and Strategies
All mutual fund companies must offer a prospectus, a published statement detailing the fund’s assets, liabilities, management personnel, and performance record. You should always take the time to read it and to take a closer look at the fund’s investments to make sure that the fund will be compatible and appropriate to your investment goals.
For example, suppose you have an investment in a TSX Index fund and now are looking for a global stock fund to complement and diversify your holdings in domestic (Canadian) equities. You go to the website of a large mutual fund company offering hundreds of funds. You find a stock fund called “Global Stock Fund”: it sounds like it’s just what you are looking for. Looking closer, however, you can see that this fund is invested in the stocks of companies in Germany, Japan, and the United Kingdom. While they are not Canadian stocks, those economies are similar to the US economy—perhaps too similar to provide the diversity you are looking for.
Or suppose you are looking for a bond fund to create income and security. You find a fund called the “Investment Grade Fixed Income Fund.” On closer inspection, however, you find that the fund does not invest only in investment grade bonds but that the average rating of its bonds is investment grade. This means that the fund invests in many investment grade bonds, but also in some speculative grade bonds, to achieve higher income. While this fund may suit your need for income, it may not be appropriate for your risk tolerance.
Mutual fund companies make this information readily available online and in prospectuses. You should always make the extra effort to be sure you know what’s in your fund. In addition, mutual funds are widely followed by many performance analysts. Ratings agencies such as Morningstar and investment publications such as Barron’s and Forbes track, analyze, and report the performance of mutual funds. That information is available online or in print and provides comparisons of mutual funds that you may find helpful in choosing your fund. For more information on Canadian mutual funds, please see the FUNDATA website.
In print and online newspapers, mutual fund performance is reported daily in the form of tables that compare the average returns of funds from week to week. Reported average returns are based on the net asset value per share (NAVPS). Investors can use this information to choose or compare funds and track the performance of funds they own.
In conclusion, since a mutual fund may be made up of any kind or many kinds of securities (e.g., stocks, bonds, real estate, and commodities), it is not really another kind of investment. Rather, it is a way to invest without specifically selecting securities, a way of achieving a desired asset allocation without choosing individual assets.
The advantages of investing in a mutual fund are the diversification available with minimal transaction costs and the professional management or security selection that you buy when you buy into the fund.
Compared to actively managed funds, passively managed or index funds offer similar diversification, but with lower management fees and expense ratios because you aren’t paying for market timing or security selection skills. The turnover ratio shows how passive or active the fund management is.
Performance history has shown that actively managed funds, on average, do not necessarily outperform passively managed funds (Malkiel, 2007).
Since they usually have higher fees, any advantage created by active management is usually cancelled out by their higher costs. Still, there are investors who believe that some mutual funds and mutual fund managers can, on average, outperform the markets or the indexes that provide the benchmarks for passively managed funds.
Key Takeaways
- Mutual funds provide investors with:
• diversification,
• security selection, and
• asset allocation. - Funds may be actively or passively managed.
- Index funds mirror an index of securities, providing diversification without security selection.
- Funds of funds provide the investor with pre-selected funds.
- Mutual funds may be structured as:
• closed-end funds,
• open-end funds, or
• exchange-traded funds. - Some funds are structured to achieve specific investment goals:
• lifestyle funds with target dates to minimize liquidity risk through asset allocation,
• leveraged funds to increase return through using debt, and
• inverse funds to increase return through active management with the expectation of a down market. - Mutual fund costs may include:
• a sales charge when shares are purchased, or front-end load,
• a sales charge when shares are sold, or back-end load,
• a management fee while shares are owned, or
• a distribution fee while shares are owned. - The management expense ratio is the total mutual fund cost expressed as a percentage of the funds invested.
- Fees vary by:
• fund sponsor,
• fund strategy (active or passive), and
• fund sales (direct or through a broker). - Returns from a mutual fund include returns on the securities it owns, including:
• interest distributions,
• dividend distributions, and
• capital gains distributions. - A fund prospectus details the fund’s investment holdings, historic returns, and costs. Mutual fund ratings in the financial media are another source of information.
Exercises
- Read Investopedia’s article “Mutual Funds: The Costs.” What is your management expense ratio (MER)? Do mutual funds with higher expenses generally earn higher returns?
- Review Investopedia’s article on “Mutual Funds: How To Read A Mutual Fund Table.” What do the columns mean? What is being compared? What can you learn from mutual fund tables that may help you choose funds or track the performance of funds you own? Share your ideas with classmates.
- In your personal finance journal, record your study of a fund you choose to track. Read the prospectus, check its ratings, and compare its week-to-week performance with that of similar funds in the mutual funds table in the financial section of a newspaper. Record your observations, questions, and commentary as you go about deciding hypothetically whether or not to invest in that fund.
REFERENCES
Investment Funds Institute of Canada. (2017). “The History of Mutual Funds.” Retrieved from: https://www.ific.ca/en/articles/who-we-are-history-of-mutual-funds/.
Kapoor, J., L. Dlabay, R. Hughes, and F. Ahmad. (2015). Personal Finance. Toronto: McGraw-Hill Ryerson.
Malkiel, B. G. (2007). A Random Walk Down Wall Street. New York: W. W. Norton & Company.
The Investment Company Institute. (2009). Investment Company Fact Book, 49th ed. Retrieved from: http://www.ici.org/pdf/2009_factbook.pdf.

Feedback/Errata