5 1.4 Accuracy and Precision of Measurements
Science is based on observation and experiment—that is, on measurements. Accuracy is how close a measurement is to the correct value for that measurement. For example, let us say that you are measuring the length of a long jump. The jump was 7.2 m long. You measure the length of the jump three times and obtain the following measurements: 7.1 m., 7.3 m., and 7.2 m. These measurements are quite accurate because they are very close to the correct value of 7.2 m. In contrast, if you had obtained a measurement of 8 m, your measurement would not be very accurate.
The precision of a measurement system is refers to how close the agreement is between repeated measurements (which are repeated under the same conditions). Consider the example of the long jump measurements. The precision of the measurements refers to the spread of the measured values. One way to analyze the precision of the measurements would be to determine the range, or difference, between the lowest and the highest measured values. In that case, the lowest value was 7.1 m. and the highest value was 7.3 m. Thus, the measured values deviated from each other by at most 0.2 m. These measurements were relatively precise because they did not vary too much in value. However, if the measured values had been 7.1, 7.3, and 7.9, then the measurements would not be very precise because there would be significant variation from one measurement to another.
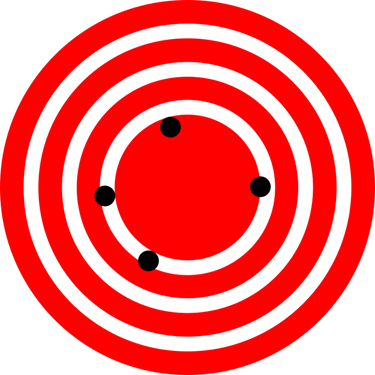
The measurements in the long jump example are both accurate and precise, but in some cases, measurements are accurate but not precise, or they are precise but not accurate. Let us consider an example of a GPS system that is attempting to locate the position of a runner in a city. Think of the runners location as existing at the centre of a bull’s-eye target, and think of each GPS attempt to locate the restaurant as a black dot. In Figure 1 you can see that the GPS measurements are spread out far apart from each other, but they are all relatively close to the actual location of the runner at the centre of the target. This indicates a low precision, high accuracy measuring system. However, in Figure 2 the GPS measurements are concentrated quite closely to one another, but they are far away from the target location. This indicates a high precision, low accuracy measuring system.

Accuracy, Precision, and Uncertainty
The degree of accuracy and precision of a measuring system are related to the uncertainty in the measurements. Uncertainty is a quantitative measure of how much your measured values deviate from a standard or expected value. If your measurements are not very accurate or precise, then the uncertainty of your values will be very high. In more general terms, uncertainty can be thought of as a disclaimer for your measured values. For example, if someone asked you to provide the estimated time you will take to complete a 50 km trail race, you might say that it will take you 8 hours, plus or minus 30 minutes. The plus or minus amount is the uncertainty in your value. That is, you are indicating that the actual time it may take you to complete the race might be as low as 7 and a half hours or as high as 8 and a half hours, or anywhere in between. All measurements contain some amount of uncertainty. In our example of measuring the length of the long jump, we might say that the length of the jump is 7.2 m., plus or minus 0.1 m. The uncertainty in a measurement, A, is often denoted as δA (“delta A”), so the measurement result would be recorded as A ± δA. In our paper example, the length of the jump could be expressed as 7.2 m. ± 0.1.
The factors contributing to uncertainty in a measurement include:
- Limitations of the measuring device,
- The skill of the person making the measurement,
- Irregularities in the object/body being measured,
- Any other factors that affect the outcome (highly dependent on the situation).
In our example, such factors contributing to the uncertainty could be the following: the smallest division on the ruler is 0.1 m. or the person using the ruler has bad eyesight.. At any rate, the uncertainty in a measurement must be based on a careful consideration of all the factors that might contribute and their possible effects.
Percent Uncertainty
One method of expressing uncertainty is as a percent of the measured value. If a measurement A is expressed with uncertainty, δA, the percent uncertainty (%unc) is defined to be:
Example 1: Calculating Percent Uncertainty: Angle of Take-off
You were told that to achieve maximum distance in your long jump, you should take-off at an angle of 45 degrees. You jump four times attempting to take-off at the optimal angle and measure the angle of take-off each time manually with a protractor. You obtain the following measurements:
- Jump 1 angle: 50 degrees
- Jump 2 angle: 65 degrees
- Jump 3 angle: 40 degrees
- Jump 4 angle: 25 degrees
You determine that the the average angle of take-off you manage to complete is 45 degrees ±20. What is the percent uncertainty of your take-off angle when using a protractor?
Strategy
First, observe that the expected value of the take-off angle, A, is 45 degrees. The uncertainty in this value, δA, is 20 degrees. We can use the following equation to determine the percent uncertainty of the weight:
Solution
Plug the known values into the equation:
Discussion
We can conclude that the take-off angle is 45 degree ±44.4%. Hint for future calculations: when calculating percent uncertainty, always remember that you must multiply the fraction by 100%. If you do not do this, you will have a decimal quantity, not a percent value.
Check Your Understanding 1
1: A high school track coach has just purchased a new stopwatch. The stopwatch manual states that the stopwatch has an uncertainty of ±0.05 s. Runners on the track coach’s team regularly clock 100-m sprints of 11.49 s to 15.01 s. At the school’s last track meet, the first-place sprinter came in at 12.04 s and the second-place sprinter came in at 12.07 s. Will the coach’s new stopwatch be helpful in timing the sprint team? Why or why not?
Summary
- Accuracy of a measured value refers to how close a measurement is to the correct value. The uncertainty in a measurement is an estimate of the amount by which the measurement result may differ from this value.
- Precision of measured values refers to how close the agreement is between repeated measurements.
Glossary
- accuracy
- the degree to which a measure value agrees with the correct value for that measurement
- percent uncertainty
- the ratio of the uncertainty of a measurement to the measure value, express as a percentage
- precision
- the degree to which repeated measurements agree with each other
Solutions
Check Your Understanding 1
1: No, the uncertainty in the stopwatch is too great to effectively differentiate between the sprint times.
