
G

Audio

Listen to an audio version of this page (23 sec):


Graph

isinakwakn

Definition: A graph is a diagram which provides a visual representation of data [3].

In 2016, Statistics Canada reported 78,025 people spoke Cree as mother tongue and 83,960 spoke it at home. There were 36,185 people speaking Inuktitut as mother tongue and 39,030 speaking it at home. There were 20,470 speaking Ojibway as mother tongue and 21,805 speaking it at home. There were 13,635 speaking Oji-Cree as mother tongue and 13,855 speaking it at home. And there were 11,320 people speaking Dene as mother tongue and 11,785 speaking it at home.
Figure 7.1 An example of the graph representing the number of Indigenous language speakers reported in the 2016 Census (Statistics Canada Open License) [11].

Group

ka âmawiyaktihk

Definition: It is a collection or assemblage of persons or things [6].
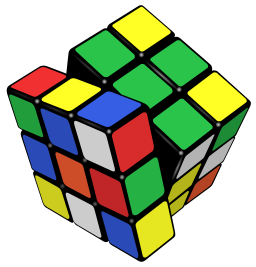
the Rubik's Cube
Figure 7.2 The manipulations of the Rubik’s Cube forms the Rubik’s Cube group by Booyabazooka at CC BY- SA 3.0 Deed.

License

Icon for the Creative Commons Attribution 4.0 International License

CREE DICTIONARY OF MATHEMATICAL TERMS WITH VISUAL EXAMPLES AND SOUND Copyright © 2024 by Arzu Sardarli is licensed under a Creative Commons Attribution 4.0 International License, except where otherwise noted.

Share This Book