15
Posting adoption statistics informs observing instructors about how their colleagues are incorporating open textbooks into their classrooms. It also sends a positive message to students—both current and potential—about the culture at their college, institute, or university.
The amount of information published about each adoption depends on decisions made by the institution’s administration or open education authority; it may be guided by its strategic plan or, if available, open education policy. Some groups elect to post anonymized numbers that show the total number of instructors, institutions, savings, and students affected, as shown in the below samples from August 2019.
BCcampus Open Education adoption statistics

eCampusOntario impact statistics

BCcampus and eCampusOntario publish adoption stats in this manner as their respective provinces’ open education projects.
BCcampus also flags each book in its collection that has been adopted by at least one instructor in the province.

Other bodies choose to publish more detailed information. In these cases, permission from the adopting instructor should be secured.
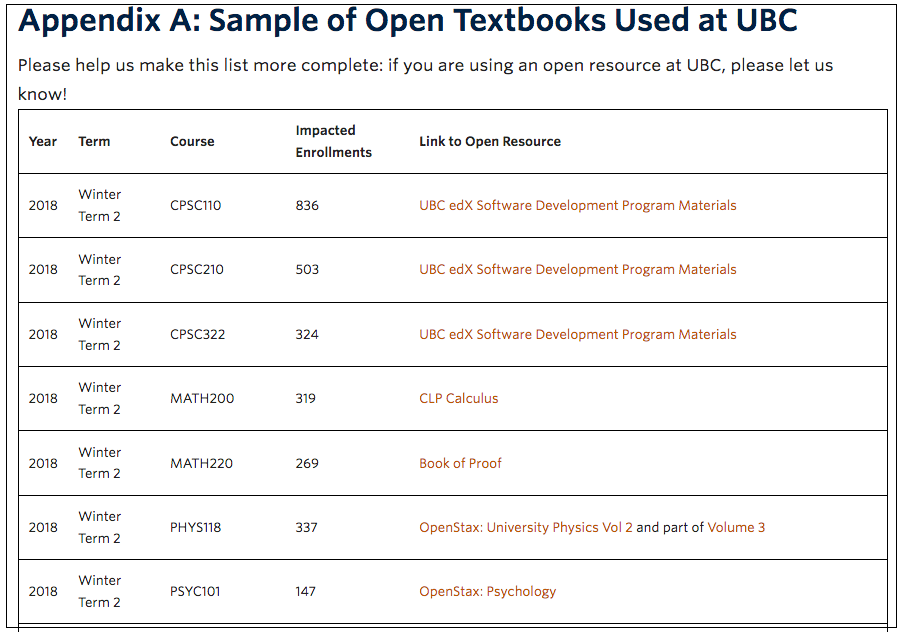
University of British Columbia’s Will Engle writes an annual OER adoption snapshot that summarizes UBC’s adoptions with definitions, student savings and impact, and strategic planning and support. A table listing all known adoptions by term, year, course name, enrolments (the largest course held over 2,000 students), and open textbook or other educational resource is shown below for 2018.
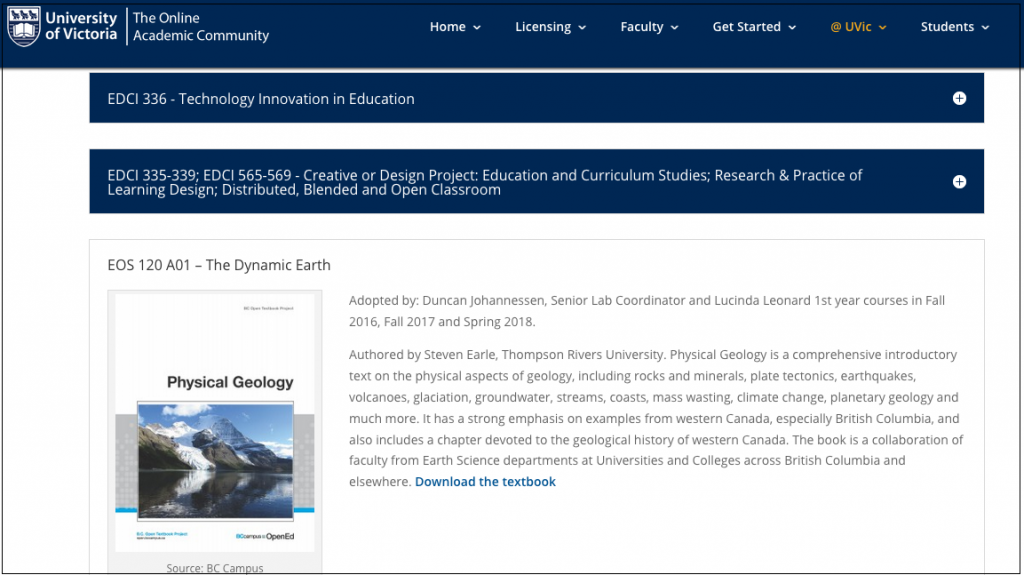
 The University of Victoria provides an alphabetical and expandable list of courses for which open textbooks or OER are used, such as the EOS 120 A01 (Dynamic Earth) course in Spring 2018. See Textbook Adoptions @ UVic.
Douglas College published a simple but comprehensive list of Open Textbooks in Use at Douglas College for Summer 2019, listing the course name, section, and instructor teaching the class.
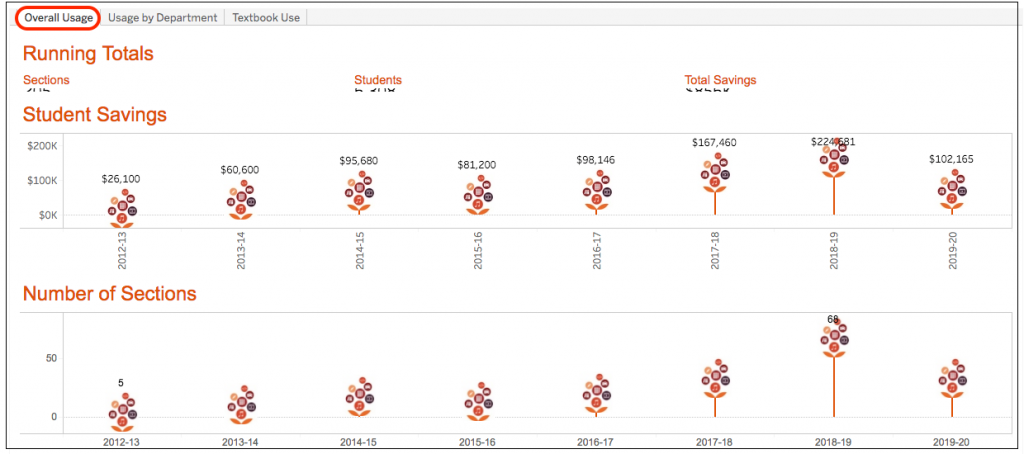
Langara College has taken a multi-prong approach, whereby adoption information is presented as overall usage according to student savings and number of course sections involved by fiscal year. The examples below capture savings up to the Summer 2019 term. See Open Langara: Overall Usage.
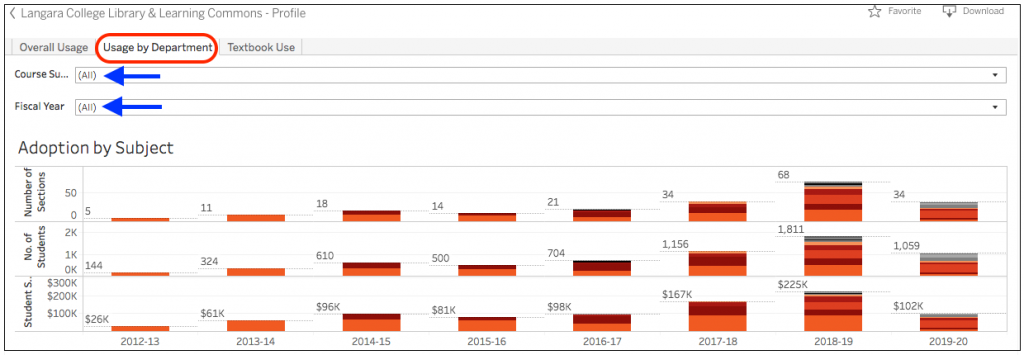
 The “Usage by Department” tab allows users to search for adoptions by course subject and fiscal year.
 Adoptions for specific courses are listed at the bottom of this page.
 The final tab provides the number of students, course sections, and total savings for all open textbooks used at Langara.
Crunch the numbers
Analysis of institution-specific adoption statistics can reveal useful information, such as usage trends by geography, course level and type, and term or semester. These numbers can then be used to promote or tag courses and programs that incorporate open textbooks partly or fully (see ZTC Programs). Identifying open textbooks that are authored by teaching faculty or published in-house further highlights an institution’s commitment to open education.
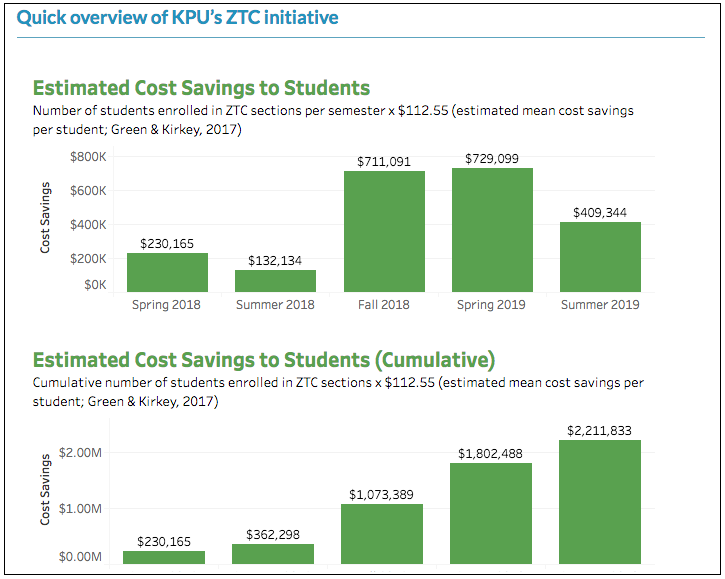
Kwantlen Polytechnic University, home to six ZTC programs, put its adoption stats to work using several bar graphs to point out how its ZTC initiatives have saved students money and produced other positive results over the years.
Long Descriptions
Open Education at BCcampus long description: Screenshot showing BCcampus open textbook adoption statistics. It says “At BCcampus, we’re using open technologies to facilitate, evaluate, and create open educational resources to share across the province and around the world; saving millions of student-dollars through hundreds of open textbooks adopted in thousands of classrooms.” Notable statistics at the time of screenshotting include:
- 40 institutions
- 605 faculty
- 133,344 students
- $12,609,057–$13,509,711 in savings
[Return to Open Education at BCcampus]
eCampusOntario impact statistics long description: Screenshot of eCampusOntario OER statistics. Numbers at the time of screenshotting include:
- 122 reported adoptions of open resources
- 314 resources in the Open Library
- 45,193 learners impacted by OER
- $4,989,224 reported in student savings
[Return to eCampusOntario impact statistics]
ZTC initiative long description: Infographic titled “Quick overview of KPU’s ZTC initiative.” It shows two bar graphs that show data for five semesters from spring 2018 to summer 2019.
The first bar graph is titled “Estimated Cost Savings to Students.” It depicts the “number of students enrolled in ZTC sections per semester × $112.55 (estimated mean cost savings per student; Green & Kirkey, 2017).” The data is as follows:
- Spring 2018: $230,165
- Summer 2018: $132,134
- Fall 2018: $711,091
- Spring 2019: $729,099
- Summer 2019: $409,344
The second bar graph is titled “Estimated Cost Savings to Students (Cumulative).” It depicts the “cumulative number of students enrolled in ZTC sections × $112.55 (estimated mean cost savings per student; Green & Kirkey, 2017).” The data is as follows:
- Spring 2018: $230,165
- Summer 2018: $362,298
- Fall 2018: $1,073,389
- Spring 2019: $1,802,488
- Summer 2019: $2,211,833
Attributions
Screenshot of eCampusOntario impact statistics is used under a CC BY-SA licence.
Screenshot of Appendix A: A Sample of Open Textbooks Used at UBC is used under a CC BY-SA licence.
Screenshot of the University of Victoria EOS 120 A01 – The Dynamic Earth is used under a CC BY licence.
Permissions
The following works are reproduced with permission.
- Screenshots (3) of Overall Usage, Usage by Department, Class Details are courtesy of Langara College
- Screenshot of Quick overview of KPU’s ZTC initiative is courtesy of Open KPU

