Week 4

Video
In this 13-minute video made available from the SDG Academy, Jeffrey Sachs looks at SDG #10 – Reduced Inequalities. This video introduces the idea of inequality in the context of a country, identifying countries that were able to reduce inequality while developing and those who were not able. It further examines the different reasons for inequality in the context of history, gender, and society.
Analysis
Reducing inequality, promoting diversity, and providing all people with the opportunity to reach their full potential is not only the right thing to do, but also good business to create a growing economy that benefits everyone[1].
Reducing inequalities and ensuring no one is left behind are integral to achieving the Sustainable Development Goals. Inequality within and among countries is a persistent cause for concern. Despite some positive signs toward reducing inequality in some dimensions, such as reducing relative income inequality in some countries and preferential trade status benefiting lower-income countries, inequality still persists. Looking at health, the United Nations estimate a global average life expectancy of 72.6 years[2]. For Canada, the life expectancy (national average) is 82.9 years, with extreme variability across the country due to many social-economical inequality factors. For example, in Hamilton, Ontario, there is a 23-year gap in life expectancy between different neighbourhoods with the highest life expectancy at 87.7 years, and the lowest at 64.8 years[3].
Inequalities are also deepening for vulnerable populations in countries with weaker health systems and those facing existing humanitarian crises. Refugees and migrants, as well as Indigenous Peoples, older persons, people with disabilities and children are particularly at risk of being left behind.
Fast Facts
- Evidence from developing countries shows that children in the poorest 20% of the populations are still up to 3 times more likely to die before their fifth birthday than children in the richest counties;
- Social protection has been significantly extended globally, yet persons with disabilities are up to 5 times more likely than average to incur catastrophic health expenditures;
- Despite overall declines in maternal mortality in most developing countries, women in rural areas are still up to 3 times more likely to die while giving birth than women living in urban centres;
- Up to 30% of income inequality is due to inequality within households, including between women and men. Women are also more likely than men to live below 50% of the median income;
- Of the 1 billion population of persons with disabilities, 80% live in developing countries;
- Globally, 1 in 10 children has a disability;
- Globally, only 28% of persons with significant disabilities have access to disability benefits, and only 1% for those in low-income countries.
Why it Matters
Why should I care about reduced inequalities? Inequality threatens long-term social and economic development, increases poverty, hunger, and poor health to name a few. This, in turn, can breed crime, disease, and environmental degradation. We cannot make the planet better for all people if many people are excluded from the chance for a better life.
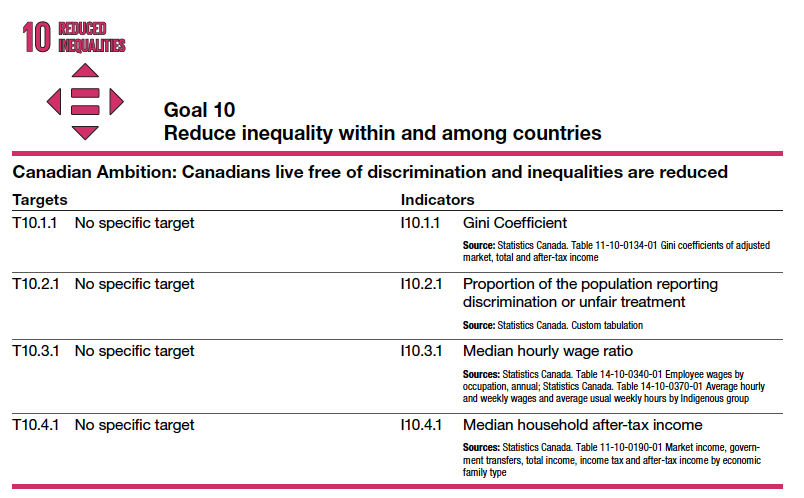
Targets and Indicators for Canada
Below is Canada’s approach to measuring progress on SDG #10 – Reduced Inequalities. Note the targets and indicators chosen[4].
Recommended Reading
- United Nations. (2021). The Sustainable Development Goal Report, 2020. Reduce inequality within and among countries.
- Global Affairs Canada. (2018). Canada’s Implementation of the 2030 Agenda for Sustainable Development: voluntary national review. ↵
- United Nations. (2021). Sustainable Development Goals. ↵
- McMaster University. (2019). Starting the conversation about social inequality and healthy aging. ↵
- Statistics Canada. (2021). The Canadian Indicator Framework for the Sustainable Development Goals - 2021. ↵


