1 Chapter 12
Chapter 12: Financial Statement Analysis
Financial statements can be used by shareholders, creditors, and other interested parties to analyze a corporation’s liquidity, profitability, and financial structure compared to prior years and other similar companies. As part of this analysis, financial evaluation tools are used. Some of these tools are discussed in this chapter.
Chapter 12 Learning Objectives
-
LO1 – Describe ratio analysis, and explain how the liquidity, profitability, leverage, and market ratios are used to analyze and compare financial statements.
-
LO2 – Describe horizontal and vertical trend analysis, and explain how they are used to analyze financial statements.
Concept Self-Check
Use the following as a self-check while working through Chapter 12.
-
What is working capital?
-
What is meant by liquidity?
-
What are some ratios commonly used to evaluate liquidity?
-
What is a company’s revenue operating cycle and how is it measured?
-
What profitability ratios can be used to evaluate a corporation?
-
How is the amount of shareholder claims against a corporation’s assets compared to the amount of creditor claims?
-
What are the relative advantages of short-term and long-term debt?
-
What are some measures used to evaluate the future financial prospects of a company for investors?
-
What is a horizontal analysis? How does it differ from a vertical analysis?
-
What is a common-size analysis?
NOTE: The purpose of these questions is to prepare you for the concepts introduced
in the chapter. Your goal should be to answer each of these questions as you read through
the chapter. If, when you complete the chapter, you are unable to answer one or more the
Concept Self-Check questions, go back through the content to find the answer(s). Solutions
are not provided to these questions.
12.1 Introduction to Ratio Analysis
LO1 – Describe ratio analysis, and explain how the liquidity, profitability, leverage, and market ratios are used to analyze and compare financial statements.
A common way to evaluate financial statements is through ratio analysis. A ratio is a relationship between two numbers of the same kind. For example, if there are two apples and three oranges, the ratio of the number of apples to the number of oranges is 2:3 (read as “two to three”). A financial ratio is a measure of the relative magnitude of two selected numerical values taken from a company’s financial statements. For instance, the gross profit percentage studied in Chapter 6, also known as the gross profit ratio, expresses the numerical relationship between gross profit and sales. If a company has a gross profit ratio of 0.25:1, this means that for every $1 of sales, the company earns, on average, $0.25 to cover expenses other than cost of goods sold. Another way of stating this is to say that the gross profit ratio is 25%.1
Financial ratios are effective tools for measuring the financial performance of a company because they provide a common basis for evaluation — for instance, the amount of gross profit generated by each dollar of sales for different companies. Numbers that appear on financial statements need to be evaluated in context. It is their relationship to other numbers and the relative changes of these numbers that provide some insight into the financial health of a business. One of the main purposes of ratio analysis is to highlight areas that require further analysis and investigation. Ratio analysis alone will not provide a definitive financial evaluation. It is used as one analytic tool, which, when combined with informed judgment, offers insight into the financial performance of a business.
For example, one business may have a completely different product mix than another company even though both operate in the same broad industry. To determine how well one company is doing relative to others, or to identify whether key indicators are changing, ratios are often compared to industry averages. To determine trends in one company’s performance, ratios are often compared to past years’ ratios of the same company.
To perform a comprehensive analysis, qualitative information about the company as well as ratios should be considered. For example, although a business may have sold hundreds of refrigerators last year and all of the key financial indicators suggest growth, qualitative information from trade publications and consumer reports may indicate that the trend will be towards refrigerators using significantly different technologies in the next few years. If the company does not have the capacity or necessary equipment to produce these new appliances, the present positive financial indicators may not accurately reflect the likely future financial performance of the company.
An examination of qualitative factors provides valuable insights and contributes to the comprehensive analysis of a company. An important source of qualitative information is also found in the notes to the financial statements, which are an integral part of the company’s financial statements.
In this chapter, financial ratios will be used to provide insights into the financial performance of Big Dog Carworks Corp. (BDCC). The ratios will focus on financial information contained within the income statement, statement of changes in equity, and balance sheet of BDCC for the three years 2019, 2020, and 2021. This information is shown below. Note that figures in these statements are reported in thousands of dollars (000s). For consistency, all final calculations in this chapter are rounded to two decimal places.
| Big Dog Carworks Corp. | ||||||||
| Balance Sheet | ||||||||
| At December 31 | ||||||||
| ($000s) | ||||||||
|
|
|
|||||||
| Assets | ||||||||
| 2021 | 2020 | 2019 | ||||||
| Current | ||||||||
|
Cash |
$ | 20 | $ | 30 | $ | 50 | ||
|
Short-term Investments |
36 | 31 | 37 | |||||
|
Accounts Receivable |
544 | 420 | 257 | |||||
|
Inventories |
833 | 503 | 361 | |||||
| 1,433 | 984 | 705 | ||||||
| Property, Plant, and Equipment, net | 1,053 | 1,128 | 712 | |||||
| Total Assets | $ | 2,486 | $ | 2,112 | $ | 1,417 | ||
| Liabilities | ||||||||
| Current | ||||||||
|
Borrowings |
$ | 825 | $ | 570 | $ | 100 | ||
|
Accounts Payable |
382 | 295 | $ | 219 | ||||
|
Income Taxes Payable |
48 | 52 | $ | 50 | ||||
| 1,255 | 917 | 369 | ||||||
| Equity | ||||||||
| Share Capital | 1,063 | 1,063 | 963 | |||||
| Retained Earnings | 168 | 132 | 85 | |||||
| 1,231 | 1,195 | 1,048 | ||||||
| Total Liabilities and Equity | $ | 2,486 | $ | 2,112 | $ | 1,417 | ||
| Big Dog Carworks Corp. | ||||||||
| Income Statement | ||||||||
| For the Year Ended December 31 | ||||||||
| ($000s) | ||||||||
|
|
|
|||||||
| 2021 | 2020 | 2019 | ||||||
| Sales (net) | $ | 3,200 | $ | 2,800 | $ | 2,340 | ||
| Cost of Goods Sold | 2,500 | 2,150 | 1,800 | |||||
| Gross Profit | 700 | 650 | 540 | |||||
| Operating Expenses | ||||||||
|
Selling, General, and Administration |
212 | 183 | 154 | |||||
|
Employee Benefits |
113 | 109 | 119 | |||||
|
Depreciation |
75 | 84 | 63 | |||||
| 400 | 376 | 336 | ||||||
| Income from Operations | 300 | 274 | 204 | |||||
| Financing Costs | ||||||||
|
Interest |
89 | 61 | -0- | |||||
| Income Before Income Taxes | 211 | 213 | 204 | |||||
|
Income Taxes |
95 | 96 | 92 | |||||
| Net Income | $ | 116 | $ | 117 | $ | 112 | ||
| Big Dog Carworks Corp. | |||||||||
| Statement of Changes in Equity | |||||||||
| For the Year Ended December 31 | |||||||||
| ($000s) | |||||||||
|
|
|
|
|
||||||
| 2021 | 2020 | 2019 | |||||||
| Share | Retained | Total | Total | Total | |||||
| Capital | Earnings | Equity | Equity | Equity | |||||
| Opening Balance | $1,063 | $132 | $1,195 | $1,048 | $ 43 | ||||
| Common Shares Issued | 100 | 953 | |||||||
| Net Income | 116 | 116 | 117 | 112 | |||||
| Dividends Declared | (80) | (80) | (70) | (60) | |||||
| Ending Balance | $1,063 | $168 | $1,231 | $1,195 | $1,048 | ||||
Assume that 100,000 common shares are outstanding at the end of 2019, 2020, and 2021. Shares were issued in 2020, but at the end of year the number of outstanding shares was still 100,000.
There are four major types of financial ratios: a) liquidity ratios that measure the ability of a corporation to satisfy demands for cash as they arise in the near-term (such as payment of current liabilities); b) profitability ratios that measure various levels of return on sales, total assets employed, and shareholder investment; c) leverage ratios that measure the financial structure of a corporation, its amount of relative debt, and its ability to cover interest expense; and d) market ratios that measure financial returns to shareholders, and perceptions of the stock market about the corporation’s value.
Initial insights into the financial performance of BDCC can be derived from an analysis of relative amounts of current and non-current debt. This analysis is addressed in the following sections.
12.2 Liquidity Ratios: Analyzing Short-term Cash Needs
Current (Short-term) versus Non-current (Long-term) Debt
Short-term and long-term financing strategies both have their advantages. The advantage of some short-term debt (repayable within one year of the balance sheet date) is that it often does not require interest payments to creditors. For example, accounts payable may not require payment of interest if they are paid within the first 30 days they are outstanding. Short-term debt also has its disadvantages; payment is required within at least one year, and often sooner. Interest rates on short-term debt are often higher than on long-term debt. An increase in the proportion of short-term debt is more risky because it must be renewed and therefore renegotiated more frequently.
The advantages of long-term debt are that payment may be made over an extended period of time. Risk may be somewhat reduced through the use of a formal contractual agreement that is often lacking with short-term debt. The disadvantages of long-term debt are that interest payments must be made at specified times and the amounts owing may be secured by assets of the company.
Analyzing Financial Structure
As a general rule, long-term financing should be used to finance long-term assets. Note that in BDCC’s case, property, plant, and equipment assets amount to $1,053,000 at December 31, 2021 yet the firm has no long-term liabilities. This is unusual. An analysis of the company’s balance sheet reveals the following:
| (000s) | |||||
| 2021 |
|
2020 |
|
2019 | |
| Current Liabilities | $1,255 | $917 | $369 | ||
| Non-current Liabilities | -0- | -0- | -0- | ||
2021 information indicates that BDCC’s management relies solely on short-term creditor financing, part of which is $382,000 of accounts payable that may bear no interest and $825,000 of borrowings that also need to be repaid within one year. The risk is that management will likely need to replace current liabilities with new liabilities. If creditors become unwilling to do this, the ability of BDCC to pay its short-term creditors may be compromised. As a result, the company may experience a liquidity crisis — the inability to pay its current liabilities as they come due. The ratios used to evaluate liquidity of a corporation are discussed below.
Even though a company may be earning net income each year (as in BDCC’s case), it may still be unable to pay its current liabilities as needed because of a shortage of cash. This can trigger various problems related to current and non-current liabilities and equity.
Current Liabilities
-
Creditors can refuse to provide any further goods or services on account.
-
Creditors can sue for payment.
-
Creditors can put the company into receivership or bankruptcy.
Non-current Liabilities
-
Long-term creditors can refuse to lend additional cash.
-
Creditors can demand repayment of their long-term debts, under some circumstances.
Equity
-
Shareholders may be unwilling to invest in additional share capital of the company.
-
Shareholders risk the loss of their investments if the company declares bankruptcy.
There are several ratios that can be used to analyze the liquidity of a company.
Working Capital
Working capital is the difference between a company’s current assets and current liabilities at a point in time. BDCC’s working capital calculation is as follows:
| (000s) | ||||||||
|
|
|
|||||||
| 2021 | 2020 | 2019 | ||||||
| Current Assets | ||||||||
|
Cash |
$ | 20 | $ | 30 | $ | 50 | ||
|
Short-term Investments |
36 | 31 | 37 | |||||
|
Accounts Receivable |
544 | 420 | 257 | |||||
|
Inventories |
833 | 503 | 361 | |||||
| Total Current Assets (a) | 1,433 | 984 | 705 | |||||
| Current Liabilities | ||||||||
|
Borrowings |
825 | 570 | 100 | |||||
|
Accounts Payable |
382 | 295 | 219 | |||||
|
Income Taxes Payable |
48 | 52 | 50 | |||||
| Total Current Liabilities (b) | 1,255 | 917 | 369 | |||||
| Net Working Capital (a-b) | $ | 178 | $ | 67 | $ | 336 | ||
In the schedule above, working capital amounts to $178,000 at December 31, 2021. Between 2019 and 2021, working capital decreased by $158,000 ($336,000 – 178,000). BDCC is less liquid in 2021 than in 2019, though its liquidity position has improved since 2020 when it was only $67,000.
In addition to calculating an absolute amount of working capital, ratio analysis can also be used. The advantage of a ratio is that it is usually easier to interpret.
![]() An exploration is available on the Lyryx system. Log into your Lyryx course to run Working Capital.
An exploration is available on the Lyryx system. Log into your Lyryx course to run Working Capital.
Current Ratio
Is BDCC able to repay short-term creditors? The current ratio can help answer this question. It expresses working capital as a proportion of current assets to current liabilities and is calculated as:
The relevant BDCC financial data required to calculate this ratio is taken from the balance sheet, as follows:
| (000s) | ||||||
| 2021 |
|
2020 |
|
2019 | ||
| Current Assets | (a) | $1,433 | $984 | $705 | ||
| Current Liabilities | (b) | 1,255 | 917 | 369 | ||
| Current Ratio | (a/b) | 1.14:1 | 1.07:1 | 1.91:1 | ||
This ratio indicates how many current asset dollars are available to pay current liabilities at a point in time. The expression “1.14:1” is read, “1.14 to 1.” In this case it means that at December 31, 2021, $1.14 of current assets exist to pay each $1 of current liabilities. This ratio is difficult to interpret in isolation. There are two types of additional information that could help. First, what is the trend within BDCC over the last three years? The ratio declined between 2019 and 2020 (from 1.91 to 1.07), then recovered slightly between the end of 2020 and 2021 (from 1.07 to 1.14). The overall decline may be a cause for concern, as it indicates that in 2021 BDCC had fewer current assets to satisfy current liabilities as they became due.
A second interpretation aid would be to compare BDCC’s current ratio to a similar company or that of BDCC’s industry as a whole. Information is available from various trade publications and business analysts’ websites that assemble financial ratio information for a wide range of industries.
Some analysts consider that a corporation should maintain a 2:1 current ratio, depending on the industry in which the firm operates. The reasoning is that, if there were $2 of current assets to pay each $1 of current liabilities, the company should still be able to pay its current liabilities as they become due, even in the event of a business downturn. However, it is recognized that no one current ratio is applicable to all entities; other factors — such as the composition of current assets — must also be considered to arrive at an acceptable ratio. This is illustrated below.
Composition of Specific Items in Current Assets
In the following example, both Corporation A and Corporation B have a 2:1 current ratio. Are the companies equally able to repay their short-term creditors?
| Corp. A |
|
Corp. B | |||
| Current Assets | |||||
|
Cash |
$ | 1,000 | $ | 10,000 | |
|
Accounts Receivable |
2,000 | 20,000 | |||
|
Inventories |
37,000 | 10,000 | |||
|
Total Current Assets |
$ | 40,000 | $ | 40,000 | |
| Current Liabilities | $ | 20,000 | $ | 20,000 | |
|
Current Ratio |
2:1 | 2:1 | |||
The companies have the same dollar amounts of current assets and current liabilities. However, they have different short-term debt paying abilities because Corporation B has more liquid current assets than does Corporation A. Corporation B has less inventory ($10,000 vs. $37,000) and more in cash and accounts receivable. If Corporation A needed more cash to pay short-term creditors quickly, it would have to sell inventory, likely at a lower-than-normal gross profit. So, Corporation B is in a better position to repay short-term creditors.
Since the current ratio doesn’t consider the components of current assets, it is only a rough indicator of a company’s ability to pay its debts as they become due. This weakness of the current ratio is partly remedied by the acid-test ratio discussed below.
![]() An exploration is available on the Lyryx system. Log into your Lyryx course to run Current Ratio.
An exploration is available on the Lyryx system. Log into your Lyryx course to run Current Ratio.
Acid-Test Ratio
A more rigid test of liquidity is provided by the acid-test ratio; also called the quick ratio. To calculate this ratio, current assets are separated into quick current assets and non-quick current assets.
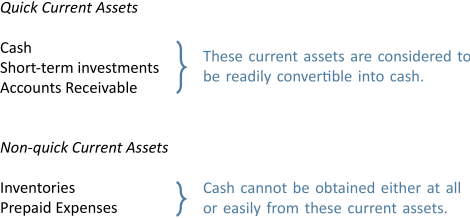
Inventory and prepaid expenses cannot be converted into cash in a short period of time, if at all. Therefore, they are excluded in the calculation of this ratio. The acid-test ratio is calculated as:
The BDCC information required to calculate this ratio is:
| (000s) | |||||||||
| 2021 |
|
2020 |
|
2019 | |||||
| Cash | $ | 20 | $ | 30 | $ | 50 | |||
| Short-term investments | 36 | 31 | 37 | ||||||
| Accounts receivable | 544 | 420 | 257 | ||||||
| Quick current assets | (a) | $ | 600 | $ | 481 | $ | 344 | ||
| Current liabilities | (b) | $ | 1,255 | $ | 917 | $ | 369 | ||
| Acid-test ratio | (a/b) | 0.48:1 | 0.52:1 | 0.93:1 | |||||
This ratio indicates how many quick asset dollars exist to pay each dollar of current liabilities. What is an adequate acid-test ratio? It is generally considered that a 1:1 acid test ratio is adequate to ensure that a firm will be able to pay its current obligations. However, this is a fairly arbitrary guideline and is not appropriate in all situations. A lower ratio than 1:1 can often be found in successful companies. However, BDCC’s acid-test ratio trend is worrisome.
There were $0.48 of quick assets available to pay each $1 of current liabilities in 2021. This amount appears inadequate. In 2020, the acid-test ratio of $0.52 also seems to be too low. The 2019 ratio of $0.93 is less than 1:1 but may be reasonable. Of particular concern to financial analysts would be BDCC’s declining trend of the acid-test ratio over the three years.
Additional analysis can also be performed to determine the source of liquidity issues. These are discussed next.
![]() An exploration is available on the Lyryx system. Log into your Lyryx course to run Acid-test Ratio.
An exploration is available on the Lyryx system. Log into your Lyryx course to run Acid-test Ratio.
Accounts Receivable Collection Period
Liquidity is affected by management decisions related to trade accounts receivable. Slow collection of receivables can result in a shortage of cash to pay current obligations. The effectiveness of management decisions relating to receivables can be analyzed by calculating the accounts receivable collection period.
The calculation of the accounts receivable collection period establishes the average number of days needed to collect an amount due to the company. It indicates the efficiency of collection procedures when the collection period is compared with the firm’s sales terms (in BDCC’s case, the sales terms are net 30 meaning that amounts are due within 30 days of the invoice date).
The accounts receivable collection period is calculated as:
The BDCC financial information required to make the calculation is shown below (the 2019 calculation cannot be made because 2018 Accounts Receivable amount is not available). Assume all of BDCC’s sales are on credit.
When Big Dog’s 30-day sales terms are compared to the 54.98-day collection period, it can be seen that an average 24.98 days of sales (54.98 days – 30 days) have gone uncollected beyond the regular credit period in 2021. The collection period in 2021 is increasing compared to 2020. Therefore, some over-extension of credit and possibly ineffective collection procedures are indicated by this ratio. Quicker collection would improve BDCC’s cash position. It may be that older or uncollectible amounts are buried in the total amount of receivables; this would have to be investigated.
Whether the increase in collection period is good or bad depends on several factors. For instance, more liberal credit terms may generate more sales (and therefore profits). The root causes of the change in the ratio need to be investigated. However, the calculation does provide an indication of the change in effectiveness of credit and collection procedures between 2020 and 2021.
![]() An exploration is available on the Lyryx system. Log into your Lyryx course to run Accounts Receivable Collection Period.
An exploration is available on the Lyryx system. Log into your Lyryx course to run Accounts Receivable Collection Period.
Number of Days of Sales in Inventory
The effectiveness of management decisions relating to inventory can be analyzed by calculating the number of days of sales that can be serviced by existing inventory levels.
The number of days of sales in inventory is calculated by dividing average inventory by the cost of goods sold and multiplying the result by 365 days.
The BDCC financial data for 2020 and 2021 required to calculate this ratio are shown below.
The calculation indicates that BDCC is investing more in inventory in 2021 than in 2020 because there are 97.53 days of sales in inventory in 2021 versus 73.34 days in 2020. BDCC has approximately 3 months of sales with its existing inventory (98 days represents about 3 months). The increase from 2020 to 2021 may warrant investigation into its causes.
A declining number of days of sales in inventory is usually a sign of good inventory management because it indicates that the average amount of assets tied up in inventory is lessening. With lower inventory levels, inventory-related expenses such as rent and insurance are lower because less storage space is often required. However, lower inventory levels can have negative consequences since items that customers want to purchase may not be in inventory resulting in lost sales.
Increasing days of sales in inventory is usually a sign of poor inventory management because an excessive investment in inventory ties up cash that could be used for other purposes. Increasing levels may indicate that inventory is becoming obsolete (consider clothing) or deteriorating (consider perishable groceries). Obsolete and/or deteriorating inventories may be unsalable. However, the possible positive aspect of more days of sales in inventory is that there can be shorter delivery time to customers if more items are in stock.
Whether Big Dog’s increasing days of sales in inventory is positive or negative depends on management’s objectives. Is management increasing inventory to provide for increased sales in the next year, or is inventory being poorly managed? Remember that ratio analyses identify areas that require investigation. The resulting investigation will guide any required action.
![]() An exploration is available on the Lyryx system. Log into your Lyryx course to run Number of Days of Sales in Inventory Ratio.
An exploration is available on the Lyryx system. Log into your Lyryx course to run Number of Days of Sales in Inventory Ratio.
The Revenue Portion of the Operating Cycle
As discussed in Chapter 4, the sale of inventory and resulting collection of receivables are part of a business’s operating cycle as shown in Figure 12.1.
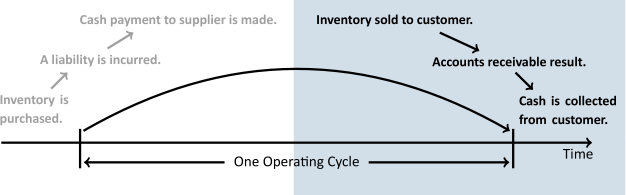
A business’s revenue operating cycle is a subset of the operating cycle and includes the purchase of inventory, the sale of inventory and creation of an account receivable, and the generation of cash when the receivable is collected. The length of time it takes BDCC to complete one revenue operating cycle is an important measure of liquidity and can be calculated by adding the number of days of sales in inventory plus the number of days it takes to collect receivables. The BDCC financial data required for this calculation follows.
| 2021 |
|
2020 | |
| Average number of days of sales in inventory | 97.53 days | 73.34 days | |
| Average number of days to collect receivables | 54.98 days | 44.13 days | |
| Number of days to complete the revenue cycle | 152.51 days | 117.47 days |
In 2021, 152.51 days were required to complete the revenue cycle, compared to 117.47 days in 2020. So, if accounts payable terms require payment within 60 days, BDCC may not be able to pay them because the number of days to complete the revenue cycle for both 2020 (117.47 days) and 2021 (152.51 days) are significantly greater than 60 days.
Analysis of BDCC’s Liquidity
Reflecting on the results of all the liquidity ratios, it appears that Big Dog Carworks Corp. is growing less liquid. Current assets, especially quick assets, are declining relative to current liabilities. The revenue operating cycle is increasing.
12.3 Profitability Ratios: Analyzing Operating Activities
Profitability ratios compare various expenses to revenues, and measure how well the assets of a corporation have been used to generate revenue.
Gross Profit Ratio
The gross profit ratio, as introduced briefly in Chapter 6, indicates the percentage of sales revenue that is left to pay operating expenses, creditor interest, and income taxes after deducting cost of goods sold. The ratio is calculated as:
![]() OR
OR ![]()
BDCC’s gross profit ratios for the three years are:
| (000s) | |||||||||
| 2021 |
|
2020 |
|
2019 | |||||
| Gross profit | (a) | $ | 700 | $ | 650 | $ | 540 | ||
| Net sales | (b) | $ | 3,200 | $ | 2,800 | $ | 2,340 | ||
| Gross profit ratio | (a/b) | 0.2188:1 or 21.88% | 0.2321:1 or 23.21% | 0.2308:1 or or 23.08% | |||||
In other words, for each dollar of sales BDCC has $0.22 of gross profit left to cover operating, interest, and income tax expenses ($0.23 in each of 2020 and 2019). The ratio has not changed significantly from year to year. However, even a small decline in this percentage can affect net income significantly because the gross profit is such a large component of the income statement. Changes in the gross profit ratio should be investigated, as it will impact future financial performance.
![]() An exploration is available on the Lyryx system. Log into your Lyryx course to run Gross profit ratio.
An exploration is available on the Lyryx system. Log into your Lyryx course to run Gross profit ratio.
Operating Profit Ratio
The operating profit ratio is one measure of relative change in these other expenses. This ratio indicates the percentage of sales revenue left to cover interest and income taxes expenses after deducting cost of goods sold and operating expenses. In other words:
![]() OR
OR ![]()
BDCC’s operating profit ratio for the 2019, 2020, and 2021 fiscal years is calculated as follows:
| (000s) | |||||||||
| 2021 |
|
2020 |
|
2019 | |||||
| Income from operations | (a) | $ | 300 | $ | 274 | $ | 204 | ||
| Net sales | (b) | $ | 3,200 | $ | 2,800 | $ | 2,340 | ||
| Operating profit ratio | (a/b) | 0.0938:1 or 9.38% | 0.0979:1 or 9.79% | 0.0872:1 or or 8.72% | |||||
For each dollar of sales revenue in 2021, the company had $0.09 left to cover interest and income tax expenses after deducting cost of goods sold and operating expenses. A review of the company’s operating expenses (selling, general, and administrative expenses; employee benefits, and depreciation) show that they have all increased. As a result, and despite increasing sales revenue and gross profit, operating income has remained relatively flat. Although it seems reasonable that an increase in operating expenses would follow an increase in sales, the reasons for the operating expense increases should be investigated.
![]() An exploration is available on the Lyryx system. Log into your Lyryx course to run Operating Profit Ratio.
An exploration is available on the Lyryx system. Log into your Lyryx course to run Operating Profit Ratio.
Net Profit Ratio
The net profit ratio is the percentage of sales revenue retained by the company after payment of operating expenses, interest expenses, and income taxes. It is an index of performance that can be used to compare the company to others in the same industry. This ratio is calculated by the following formula:
![]() OR
OR ![]()
BDCC’s net profit ratios for the three years are calculated as follows:
| (000s) | |||||||||
| 2021 |
|
2020 |
|
2019 | |||||
| Net income | (a) | $ | 116 | $ | 117 | $ | 112 | ||
| Net sales | (b) | $ | 3,200 | $ | 2,800 | $ | 2,340 | ||
| Net profit ratio | (a/b) | 0.0363:1 or 3.63% | 0.418:1 or 4.18% | 0.0479:1 or or 4.79% | |||||
For each $1 of sales in 2021, BDCC earned $0.04 of net income. The net profit ratio has been relatively stable but needs to be compared with industry or competitors’ averages for a better perspective.
Recall that revenues are generated from a business’s asset holdings. The financial strength and success of a corporation depends on the efficient use of these assets. An analysis of asset investment decisions can be made by calculating several ratios, and is discussed next.
![]() An exploration is available on the Lyryx system. Log into your Lyryx course to run Net Profit Ratio.
An exploration is available on the Lyryx system. Log into your Lyryx course to run Net Profit Ratio.
Sales to Total Assets Ratio
Are BDCC’s sales adequate in relation to its assets? The calculation of the sales to total assets ratio helps to answer this question by establishing the number of sales dollars earned for each dollar invested in assets. The ratio is calculated as:
![]() OR
OR ![]()
BDCC’s ratios are calculated as follows:
The ratio has decreased from 2020 to 2021. Each $1 of investment in assets in 2020 generated sales of $1.59. In 2021, each $1 of investment in assets generated only $1.39 in sales. Over the same period, BDCC’s investment in assets increased. The ratios indicate that the additional assets are not producing revenue as effectively as in the past. It may be too soon to tell whether the increase in assets in 2020 will eventually create greater sales but an investigation is required.
As noted earlier, comparison with industry averages would be useful. A low ratio in relation to other companies in the same industry may indicate an over-investment in or inefficient use of assets by BDCC. On the other hand, a higher ratio in comparison to other companies would be a positive indicator.
![]() An exploration is available on the Lyryx system. Log into your Lyryx course to run Sales to Total Assets Ratio.
An exploration is available on the Lyryx system. Log into your Lyryx course to run Sales to Total Assets Ratio.
Return on Total Assets Ratio (ROA)
The return on total assets ratio or ROA is designed to measure the efficiency with which all of a company’s assets are used to produce income from operations. The ratio is calculated as:
![]() OR
OR ![]()
Note that expenses needed to finance the company operations are excluded from the calculation, specifically interest and income taxes. This is because all the assets of the company are considered in the ratio’s denominator, whether financed by investors or creditors. Average Total Assets are used in the calculation because the amount of assets used likely varies during the year. The use of averages tends to smooth out such fluctuations.
BDCC’s returns on total assets for 2020 and 2021 are calculated as follows:
The ratios indicate that Big Dog earned $0.13 of income from operations for every $1 of average total assets in 2021, a decrease from $0.16 per $1 in 2020. This downward trend indicates that assets are being used less efficiently. However, it may be that the increased investment in assets has not yet begun to pay off. On the other hand, although sales are increasing, it is possible that future sales volume will not be sufficient to justify the increase in assets. More information about the company’s plans and projections would be useful. Recall that ratio analysis promotes the asking of directed questions for the purpose of more informed decision making.
![]() An exploration is available on the Lyryx system. Log into your Lyryx course to run Return on Total Assets Ratio.
An exploration is available on the Lyryx system. Log into your Lyryx course to run Return on Total Assets Ratio.
Return on Equity Ratio (ROE)
The return on equity ratio measures the return to shareholders — how much net income was earned for the owners of a business. It is calculated as:
![]() OR
OR ![]()
The 2020 and 2021 returns on equity ratios for BDCC are calculated as follows (note that the 2019 ratio is excluded because average equity cannot be calculated since 2018 ending balances are not provided):
In both years, shareholders earned, on average, $0.10 for every $1 invested in BDCC, or 10%. Industry averages could help with this analysis. For instance, if the industry as a whole earned only a 5% return on equity in 2021, it could be concluded that BDCC performed better than the industry average in terms of return on equity.
![]() An exploration is available on the Lyryx system. Log into your Lyryx course to run Return on Equity Ratio.
An exploration is available on the Lyryx system. Log into your Lyryx course to run Return on Equity Ratio.
12.4 Leverage Ratios: Analyzing Financial Structure
The accounting equation expresses a relationship between assets owned by an entity and the claims against those assets. Although shareholders own a corporation, they alone do not finance the corporation; creditors also finance some of its activities. Together, creditor and shareholder capital are said to form the financial structureFinancial structure of a corporation. At December 31, 2021, the balance sheet of BDCC shows the following financial structure:
| ASSETS | = | LIABILITIES | + | EQUITY |
| $2,486 | = | $1,255 | + | $1,231 |
Debt Ratio
The proportion of total assets financed by debt is called the debt ratio, and is calculated by dividing total liabilities by total assets.
![]() OR
OR ![]()
In BDCC’s case, these amounts are:
| (000s) | ||||||
| 2021 |
|
2020 | ||||
| Total liabilities | (a) | $ | 1,255 | $ | 917 | |
| Total assets | (b) | $ | 2,486 | $ | 2,112 | |
| Debt ratio | (a/b) | 0.5048:1 or 50.48% | 0.4342:1 or 43.42% | |||
In other words, 50.48% of BDCC’s assets are financed by debt. Therefore, because assets are financed by debt (aka liabilities) and equity, we intuitively know that 49.52% of BDCC’s assets must be financed by equity which is the topic of the next section.
![]() An exploration is available on the Lyryx system. Log into your Lyryx course to run Debt Ratio.
An exploration is available on the Lyryx system. Log into your Lyryx course to run Debt Ratio.
Equity Ratio
The proportion of total assets financed by equity is called the equity ratio, and is calculated by dividing total equity by total assets. In BDCC’s case, these amounts are:
| (000s) | ||||||
| 2021 |
|
2020 | ||||
| Total equity | (a) | $ | 1,231 | $ | 1,195 | |
| Total assets | (b) | $ | 2,486 | $ | 2,112 | |
| Equity ratio | (a/b) | 0.4952:1 or 49.52% | 0.5658:1 or 56.58% | |||
In 2021, 49.52% of the assets were financed by equity while in 2020 56.58% of the assets were financed by equity. Generally, this is considered an unfavourable trend because as equity financing decreases, we know that debt financing must be increasing as evidenced by the debt ratio above. The greater the debt financing, the greater the risk because principal and interest payments are part of debt financing.
Notice that the sum of the debt and equity ratios will always equal 100% because of the accounting equation relationship: A = L + E where A = 100% and, in the case of BDCC, L = 43.42% in 2020 and E = 56.58% in 2020.
![]() An exploration is available on the Lyryx system. Log into your Lyryx course to run Equity Ratio.
An exploration is available on the Lyryx system. Log into your Lyryx course to run Equity Ratio.
Debt to Equity Ratio
The proportion of creditor to shareholders’ claims is called the debt to equity ratio, and is calculated by dividing total liabilities by equity. In BDCC’s case, these amounts are:
| (000s) | |||||||||
| 2021 |
|
2020 |
|
2019 | |||||
| Total liabilities | (a) | $ | 1,255 | $ | 917 | $ | 369 | ||
| Equity | (b) | $ | 1,231 | $ | 1,195 | $ | 1,048 | ||
| Debt to equity ratio | (a/b) | 1.02:1 | 0.77:1 | 0.35:1 | |||||
In other words, BDCC has $1.02 of liabilities for each dollar of equity at the end of its current fiscal year, 2021. The proportion of debt financing has been increasing since 2019. In 2019 there was only $0.35 of debt for each $1 of equity. In 2021, creditors are financing a greater proportion of BDCC than are shareholders. This may be a cause for concern.
On the one hand, management’s reliance on creditor financing is good. Issuing additional shares might require existing shareholders to give up some of their control of BDCC. Creditor financing may also be more financially attractive to existing shareholders if it enables BDCC to earn more with the borrowed funds than the interest paid on the debt.
On the other hand, management’s increasing reliance on creditor financing increases risk because interest and principal have to be paid on this debt. Before deciding to extend credit, creditors often look at the total debt load of a company, and therefore the company’s ability to meet interest and principal payments in the future. Total earnings of BDCC could be reduced if high interest payments have to be made, especially if interest rates rise. Creditors are interested in a secure investment and may evaluate shareholder commitment by measuring relative amounts of capital invested. From the creditors’ perspective, the more capital invested by owners of the company, the greater the relative risk assumed by shareholders thus decreasing risk to creditors.
Although there is no single most appropriate debt to equity ratio, there are techniques for estimating the optimum balance. These are beyond the scope of introductory financial accounting. For now, it is sufficient to note that for BDCC the debt to equity ratio has increased considerably over the three-year period which is generally unfavourable because of the risk associated with debt financing.
![]() An exploration is available on the Lyryx system. Log into your Lyryx course to run Debt to Equity Ratio.
An exploration is available on the Lyryx system. Log into your Lyryx course to run Debt to Equity Ratio.
Times Interest Earned Ratio
Creditors are interested in evaluating a company’s financial performance, in order to project whether the firm will be able to pay interest on borrowed funds and repay the debt when it comes due. Creditors are therefore interested in measures such as the times interest earned ratio. This ratio indicates the amount by which income from operations could decline before a default on interest may result. The ratio is calculated by the following formula:
Note that income from operations is used, so that income before deduction of creditor payments in the form of income taxes and interest is incorporated into the calculation. BDCC’s 2020 and 2021 ratios are calculated as follows:
| (000s) | |||||||||
| 2021 |
|
2020 |
|
2019 | |||||
| Income from operations | (a) | $ | 300 | $ | 274 | $ | 204 | ||
| Interest expense | (b) | $ | 89 | $ | 61 | -0- | |||
| Times interest earned ratio | (a/b) | 3.37:1 | 4.49:1 | n/a | |||||
The larger the ratio, the better creditors are protected. BDCC’s interest coverage has decreased from 2020 to 2021 (3.37 times vs. 4.49 times), but income would still need to decrease significantly for the company to be unable to pay its obligations to creditors. The analysis does indicate, though, that over the past two years interest charges have increased compared to income from operations. Creditors need to assess company plans and projections, particularly those affecting income from operations, to determine whether their loans to the company are at risk. As discussed above, it may be that significant investments in assets have not yet generated related increases in sales and income from operations.
![]() An exploration is available on the Lyryx system. Log into your Lyryx course to run Times Interest Earned Ratio.
An exploration is available on the Lyryx system. Log into your Lyryx course to run Times Interest Earned Ratio.
12.5 Market Ratios: Analysis of Financial Returns to Investors
Investors frequently consider whether to invest or divest in shares of a corporation. There are various ratios that help them make this decision. These are called market ratios, because the stock market plays an important role in allocating financial resources to corporations that offer their shares to the public.
Earnings-per-Share (EPS)
Measures of efficiency can focus on shareholder returns on a per-share basis. That is, the amount of net income earned in a year can be divided by the number of common shares outstanding to establish how much return has been earned for each outstanding share. This earnings-per-share (EPS) value is calculated as:
EPS is quoted in financial markets and is disclosed on the income statement of publicly-traded companies. If there are preferred shareholders, they have first rights to distribution of dividends. Therefore, when calculating EPS, preferred shareholders’ claims on net income are deducted from net income to calculate the amount available for common shareholders:
BDCC has no preferred shares and thus no preferred share dividends. Recall that 100,000 common shares are outstanding at the end of 2019, 2020, and 2021. For BDCC, EPS calculations for the three years are:
| (000s) | |||||||||
| 2021 |
|
2020 |
|
2019 | |||||
| Net income | (a) | $ | 116 | $ | 117 | $ | 112 | ||
| Number of common shares outstanding | (b) | 100 | 100 | 100 | |||||
| Earnings per share | (a/b) | $ | 1.16 | $ | 1.17 | $ | 1.12 | ||
Big Dog’s EPS has remained relatively constant over the three-year period because both net income and number of outstanding shares have remained fairly stable. Increasing sales levels and the resulting positive effects on net income, combined with unchanged common shares issued, has generally accounted for the slight increase from 2019 to 2020.
![]() An exploration is available on the Lyryx system. Log into your Lyryx course to run Earnings Per Share.
An exploration is available on the Lyryx system. Log into your Lyryx course to run Earnings Per Share.
Price-earnings (P/E) Ratio
A price at which a common share trades on a stock market is perhaps the most important measure of a company’s financial performance. The market price of one share reflects the opinions of investors about a company’s future value compared to alternative investments.
The earnings performance of common shares is often expressed as a price-earnings (P/E) ratio. Price-earnings (P/E) ratio It is calculated as:
This ratio is used as an indicator of the market’s expectation of a company’s future performance. Assume Company A has a current market value of $15 per share and an EPS of $1 per share. It will have a P/E ratio of 15. If Company B has a market value of $4 per share and an EPS of $0.50 per share, it will have a P/E ratio of 8. This means that the stock market expects Company A to earn relatively more in the future than Company B. For every $1 of net income generated by Company A, investors are willing to invest $15. In comparison, for every $1 of net income generated by Company B, investors are willing to pay only $8. Investors perceive shares of Company A as more valuable because the company is expected to earn greater returns in the future than is Company B.
Assume that BDCC’s average market price per common share was $4 in 2019, $5 in 2020, and $6 in 2021. Its P/E ratio would be calculated as:
| (000s) | |||||||||
| 2021 |
|
2020 |
|
2019 | |||||
| Market price per common share | (a) | $ | 6.00 | $ | 5.00 | $ | 4.00 | ||
| Earnings per share (see above) | (b) | $ | 1.16 | $ | 1.17 | $ | 1.12 | ||
| Price-earnings ratio | (a/b) | 5.17 | 4.27 | 3.57 | |||||
BDCC’s P/E ratio has increased each year. Although industry and competitor’s P/E ratio comparisons would be important to compare, BDCC’s increasingly positive ratio also indicates that investors are “bullish” on BDCC. That is, the stock market indicates that it expects BDCC to be increasingly profitable in the coming years. Despite a relatively constant EPS ratio from 2019 to 2021, investors are willing to pay more and more for the company’s common shares. This must be because future financial prospects are anticipated to be better than in the past three years.
![]() An exploration is available on the Lyryx system. Log into your Lyryx course to run Price-Earnings Ratio.
An exploration is available on the Lyryx system. Log into your Lyryx course to run Price-Earnings Ratio.
Dividend Yield
Some investors’ primary objective is to maximize dividend revenue from share investments, rather than realize an increasing market price of the shares. This type of investor is interested in information about the earnings available for distribution to shareholders and the actual amount of cash paid out as dividends rather than the market price of the shares.
The dividend yield ratio is a means to determine this. It is calculated as:
This ratio indicates how large a return in the form of dividends can be expected from an investment in a company’s shares. The relevant information for BDCC over the last three years is shown in the financial statements, as follows:
| (000s – except per share values) | |||||||||
| 2021 |
|
2020 |
|
2019 | |||||
| Dividends declared | (a) | $ | 80 | $ | 70 | $ | 60 | ||
| Outstanding common shares | (b) | 100 | 100 | 100 | |||||
| Dividends per share | (a/b) | $ | 0.80 | $ | 0.70 | $ | 0.60 | ||
The dividend yield ratio is therefore:
| 2021 |
|
2020 |
|
2019 | |||||
| Dividends per share | (a) | $ | 0.80 | $ | 0.70 | $ | 0.60 | ||
| Market price per share (given) | (b) | $ | 6.00 | $ | 5.00 | $ | 4.00 | ||
| Dividend yield ratio | (a/b) | 0.13:1 | 0.14:1 | 0.15:1 | |||||
The company’s dividend yield ratio decreased from 2019 to 2021. In 2019, investors received $0.15 for every $1 invested in shares. By 2021, this had decreased to $0.13 for every $1 invested. Though the decline is slight, the trend may concern investors who seek steady cash returns. Also notice that total dividends declared increased from 2019 to 2021 even though net income did not substantially increase, and despite the company’s poor liquidity position noted in an earlier analysis. Investors might ask why such high levels of dividends are being paid given this situation.
![]() An exploration is available on the Lyryx system. Log into your Lyryx course to run Dividend Yield.
An exploration is available on the Lyryx system. Log into your Lyryx course to run Dividend Yield.
12.6 Overall Analysis of Big Dog’s Financial Statements
Results of ratio analysis are always more useful if accompanied by other information such as overall industry performance, the general economy, financial ratios of prior years, and qualitative factors such as analysts’ opinions and management’s plans.
However, there are some interpretations that can be made about BDCC from the foregoing ratio analyses even without other information. Although BDCC is experiencing growth in sales, net income has not substantially increased over the three-year period 2019 to 2021. The gross profit ratio is relatively constant. Their increasing operating expenses appear to be an issue. The sales to total assets and return on assets ratios have decreased due to a recent investment in property, plant and equipment assets and growth in current assets. Income from operations has not increased with the growth in the asset base. However, it may be premature to make conclusions regarding the timing of outlays for property, plant, and equipment.
The most immediate problem facing BDCC is the shortage of working capital and its poor liquidity. BDCC expanded its property, plant, and equipment in 2020 and experienced increases in revenue that did not correspond to increases in accounts receivable and inventories. The company should therefore review its credit policies and monitor its investment in inventory to ensure that these expand in proportion to sales.
The plant expansion produced an increase in current liabilities (mainly borrowings). The company’s ability to meet its debt obligations appears to be deteriorating. The ability of income from operations to cover interest expense has declined. The company’s liquidity position is deteriorating, even though it continues to produce net income each year. BDCC should investigate alternatives to short-term borrowings, such as converting some of this to long-term debt and/or issuing additional share capital to retire some of its short-term debt obligations.
Despite these challenges, the stock market indicates that it expects BDCC to be increasingly profitable in the future. Perhaps it views the negative indicators noted above as only temporary or easily rectified by management.
The next section provides further insights into BDCC’s operations through trend analysis of the company’s financial statements.
12.7 Horizontal and Vertical Trend Analysis
LO2 – Describe horizontal and vertical trend analysis, and explain how they are used to analyze financial statements.
Trend analysis is the evaluation of financial performance based on a restatement of financial statement dollar amounts to percentages. Horizontal analysis and vertical analysis are two types of trend analyses.
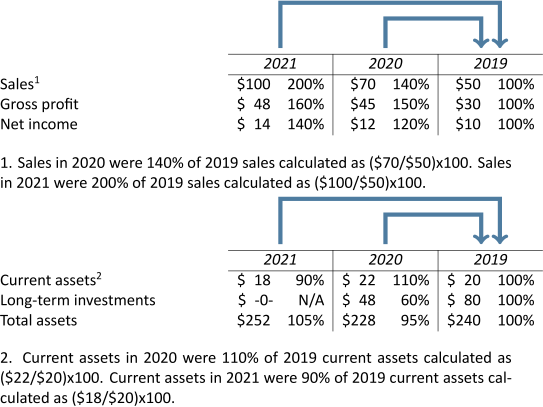
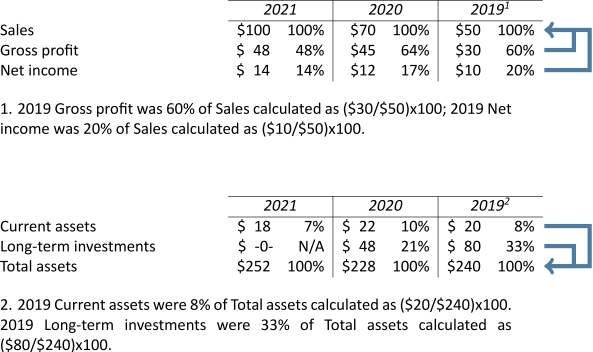
Horizontal analysis involves the calculation of percentage changes from one or more years over the base year dollar amount. The base year is typically the oldest year and is always 100%. The following two examples of horizontal analysis use an abbreviated income statement and balance sheet information where 2019 represents the base year. For demonstration purposes, the percentages have been rounded to the nearest whole number.
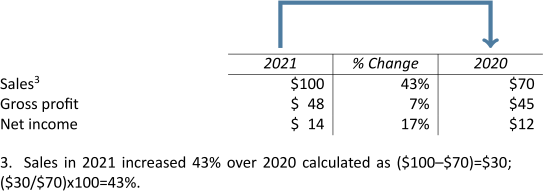
An alternate method of performing horizontal analysis calculations is to simply calculate the percentage change between two years as shown in the following example.
![]() An exploration is available on the Lyryx system. Log into your Lyryx course to run Horizontal Analysis.
An exploration is available on the Lyryx system. Log into your Lyryx course to run Horizontal Analysis.
Vertical analysis requires numbers in a financial statement to be restated as percentages of a base dollar amount. For income statement analysis, the base amount used is sales. For balance sheet analysis, total assets, or total liabilities and equity, are used as the base amounts. When financial statements are converted to percentages, they are called common-size financial statements. The following two examples of vertical analysis use information from an abbreviated income statement and balance sheet.
![]() An exploration is available on the Lyryx system. Log into your Lyryx course to run Vertical Analysis.
An exploration is available on the Lyryx system. Log into your Lyryx course to run Vertical Analysis.
Notice that the same information was used for both the horizontal and vertical analyses examples but that the results are different because of how the dollar amounts are being compared.
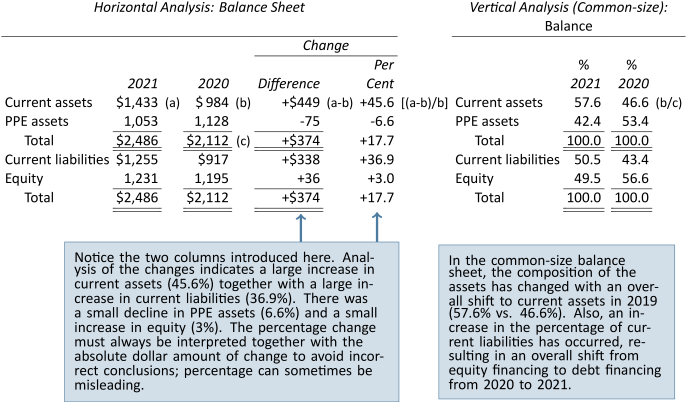
Horizontal and vertical analyses of the balance sheets of Big Dog Carworks Corp. are as follows:
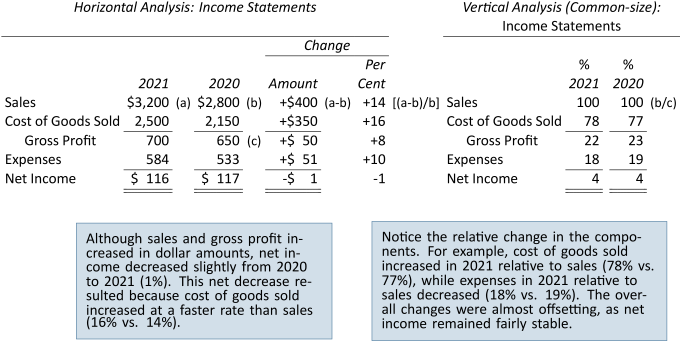
The same analysis of BDCC’s income statement is as follows:
The percentages calculated become more informative when compared to earlier years. Further analysis is usually undertaken in order to establish answers to the following questions:
| What caused this change? |
|
How do the percentages of this |
| Is this change favourable or | company compare with other | |
| unfavourable? | companies in the same industry? | |
| In other industries? |
These and similar questions call attention to areas that require further study. One item of note becomes more apparent as a result of the trend analysis above. Initially, it was stated that operating expenses were increasing between 2019 and 2021. Based on trend analysis, however, these expenses are actually declining as a percentage of sales. As a result, their fluctuations may not be as significant as first inferred. Conversely, the increases each year in cost of goods sold may be worrisome. Initial gross profit ratio calculations seemed to indicate little variation, and thus little effect on income from operations. The increase in cost of goods sold (78% vs. 77% of sales) may warrant further investigation.
The ratios covered in this chapter are summarized in Figure 12.2.
| Analysis of liquidity: | Calculation of ratio: | Indicates: |
| 1. Working Capital | Current assets – Current liabilities | The excess of current assets available after covering current liabilities (expressed as a dollar amount). |
| 2. Current ratio | |
The amount of current assets available to pay current liabilities. |
| 3. Acid-test ratio | |
Whether the company is able to meet the immediate demands of creditors. (This is a more severe measure of liquidity.) |
| 4. Accounts receivable collection period | 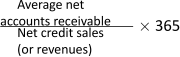 |
The average time needed to collect receivables. |
| 5. Number of days of sales in inventory | |
How many days of sales can be made with existing inventory |
| 6. Revenue operating cycle | Average number of days to collect receivables + Average number of days of sales inventory | Length of time between the purchase of inventory and the subsequent collection of cash. |
| Analysis of profitability: | Calculation of ratio: | Indicates: |
| 1. Gross profit ratio | |
The percentage of sales revenue that is left to pay operating expenses, interest, and income taxes after deducting cost of goods sold. |
| 2. Operating profit ratio | |
The percentage of sales revenue that is left to pay interest and income taxes expenses after deducting cost of goods sold and operating expenses. |
| 3. Net profit ratio | |
The percentage of sales left after payment of all expenses. |
| 4. Sales to total assets ratio | |
The adequacy of sales in relation to the investment in assets. |
| 5. Return on total assets | |
How efficiently a company uses its assets as resources to earn net income. |
| 6. Return on equity | |
The adequacy of net income as a return on equity. |
| Leverage ratios: | Calculation of ratio: | Indicates: |
| 1. Debt ratio | |
The proportion of total assets financed by debt. |
| 2. Equity ratio | |
The proportion of total assets financed by equity. |
| 3. Debt to equity ratio | |
The proportion of creditor financing to shareholder financing. |
| 4. Times interest earned ratio | |
The ability of a company to pay interest to long-term creditors. |
| Market ratios: | Calculation of ratio: | Indicates: |
| 1. Earnings per share | |
The amount of net income that has been earned on each common share after deducting dividends to preferred shareholders. |
| 2. Price-earnings ratio | |
Market expectations of future profitability. |
| 3. Dividend yield ratio | |
The short-term cash return that can be expected from an investment in a company’s shares. |
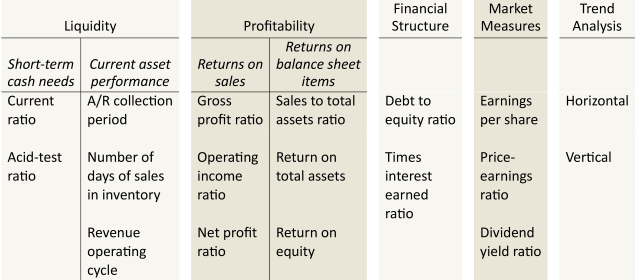
Schematically, the various analytical tools can be illustrated as shown in Figure 12.3.
Summary of Chapter 12 Learning Objectives
LO1 – Describe ratio analysis, and explain how the liquidity, profitability, leverage, and market ratios are used to analyze and compare financial statements.
Ratio analysis measures the relative magnitude of two selected numerical values taken from a company’s financial statements and compares the result to prior years and other similar companies. Financial ratios are an effective tool for measuring: (a) liquidity (current ratio, acid-test ratio, accounts receivable collection period, and number of days of sales in inventory); (b) profitability (gross profit ratio, operating profit ratio, net profit ratio, sales to total assets ratio, return on total assets, and return on equity); (c) leverage (debt ratio, equity ratio, debt to equity ratio, and times interest earned ratio); and (d) market ratios (earnings per share, price-earnings ratio, and dividend yield ratio). Ratios help identify the areas that require further investigation.
LO2 – Describe horizontal and vertical trend analysis, and explain how they are used to analyze financial statements.
Horizontal analysis involves the calculation of percentage changes from one or more years over the base year dollar amount. The base year is typically the oldest year and is always 100%. Vertical analysis requires that numbers in a financial statement be restated as percentages of a base dollar amount. For income statement analysis, the base amount used is sales. For balance sheet analysis, total assets, or total liabilities and equity, are used as the base amounts. When financial statements are converted to percentages, they are called common-size financial statements.
Discussion Questions
-
Ratios need to be evaluated against some base. What types of information can be used to compare ratios against?
-
Explain what liquidity means. When a corporation is illiquid, what are the implications for shareholders? …for creditors?
-
How is it possible that a corporation producing net income each year can be illiquid?
-
What ratios can be calculated to evaluate liquidity? Explain what each one indicates.
-
-
Define working capital. Distinguish between the current ratio and the acid-test ratio.
-
“The current ratio is, by itself, inadequate to measure liquidity.” Discuss this
statement.
-
-
Two firms have the same amount of working capital. Explain how it is possible that one is able to pay off short-term creditors, while the other firm cannot.
-
Management decisions relating to accounts receivable and inventory can affect liquidity. Explain.
-
What is one means to evaluate the management of accounts receivable? …inventory?
-
Discuss the advantages and disadvantages of decreasing number of days of sales in inventory.
-
What is the revenue operating cycle? How is its calculation useful in evaluating liquidity?
-
-
Identify and explain six ratios (and any associated calculations) that evaluate a corporation’s profitability.
-
What does each ratio indicate?
-
-
Why are analysts and investors concerned with the financial structure of a corporation?
-
Is the reliance on creditor financing good or bad? Explain its impact on net income.
-
Discuss the advantages and disadvantages of short-term debt financing compared to long-term debt financing.
-
Identify and explain ratios that evaluate financial returns for investors.
-
Distinguish between horizontal and vertical analyses of financial statements.
Exercises
The following are condensed comparative financial statements of Stockwell Inc. for the three years ended December 31, 2015.
| Balance Sheet | |||||
| At December 31 | |||||
|
|
|||||
| Assets | |||||
| 2015 | 2014 | 2013 | |||
| Current | |||||
|
Cash |
$
21 |
$
8 |
$
17 |
||
|
Accounts Receivable |
38 | 30 | 20 | ||
|
Merchandise Inventory |
60 | 40 | 30 | ||
|
Prepaid Expenses |
1 | 2 | 3 | ||
|
Total Current Assets |
120 | 80 | 70 | ||
|
Property, plant and equipment assets,
|
260 | 150 | 76 | ||
| at carrying amount | |||||
| Total Assets | $380 | $230 | $146 | ||
| Liabilities | |||||
| Current | |||||
|
Accounts Payable |
$100 | $
80 |
$
50 |
||
| Non-current | |||||
|
Bonds Payable, 4% |
50 | 50 | -0- | ||
| 150 | 130 | 50 | |||
| Equity | |||||
| Common Shares | 200 | 80 | 80 | ||
| Retained Earnings | 30 | 20 | 16 | ||
| 230 | 100 | 96 | |||
| Total Liabilities and Equity | $380 | $230 | $146 | ||
| Income Statement | |||||
| For the Years Ended December 31 | |||||
|
|
|||||
| 2015 | 2014 | 2013 | |||
| Sales | $210 | $120 | $100 | ||
| Cost of Goods Sold | 158 | 80 | 55 | ||
| Gross Profit | 52 | 40 | 45 | ||
|
Operating Expenses |
35 | 32 | 33 | ||
| Income from Operations | 17 | 8 | 12 | ||
|
Interest Expense |
2 | 2 | -0- | ||
| Income before Income Taxes | 15 | 6 | 12 | ||
|
Income Taxes |
5 | 2 | 4 | ||
| Net Income | $
10 |
$
4 |
$
8 |
||
Additional information:
-
The company’s accounts receivable at December 31, 2012 totalled $20.
-
The company’s merchandise inventory at December 31, 2012 totalled $20.
-
The company’s property, plant and equipment assets at December 31, 2012 totalled $70.
-
Credit terms are net 60 days from date of invoice.
-
Number of common shares outstanding: 2013–80, 2014–80, 2015–400.
Required:
-
Calculate liquidity ratios and discuss.
-
What is your evaluation of
-
The financial structure of the corporation?
-
The proportion of shareholder and creditor claims to its assets?
-
The structure of its short-term and long-term credit financing?
-
-
What are some other observations you can make about the financial
performance of Stockwell?
The following information relates to three companies in the same industry:
| Latest | Earnings | Dividends | ||||
| Company | market price | per share | per share | |||
| A | $
35 |
$
11 |
$
-0- |
|||
| B | 40 | 5 | 4 | |||
| C | 90 | 10 | 6 |
Required: Explain and calculate the price-earnings and dividend yield ratios. On the basis of only the foregoing information, which company represents the most attractive investment opportunity to you? Explain.
Consider the following information:
| Salinas Limited | ||||
| Balance Sheet | ||||
| At December 31, 2012 | ||||
| Assets | Liabilities and Equity | |||
| Cash | $
72 |
Accounts Payable | $
60 |
|
| Accounts Receivable | 88 | Bank Loan, non-current | 150 | |
| Merchandise Inventory | 100 | |||
| Prepaid Expenses | 40 | Preferred Shares | 60 | |
|
Property, Plant, and Equipment,
|
Common Shares | 250 | ||
|
at carrying amount |
320 | Retained Earnings | 100 | |
|
Total Assets |
$620 |
Total Liabilities and Equity |
$620 | |
| Salinas Limited | |||
| Income Statement | |||
| For the Year Ended December 31, 2012 | |||
| Sales | $240 | ||
| Cost of Goods Sold | 144 | ||
| Gross Profit | 96 | ||
| Operating Expenses | |||
|
Salaries |
$
44 |
||
|
Depreciation |
6 | 50 | |
| Income from Operations | 46 | ||
|
Less: Interest |
8 | ||
|
Income before Income Taxes
|
38 | ||
|
Less: Income Taxes |
18 | ||
| Net Income | $
20 |
||
Assume that 80% of sales are on credit, that the average of all balance sheet items is equal to the year-end figure, that all preferred share dividends have been paid and the total annual preferred dividend entitlement is $6, and that the number of common shares outstanding is 10.
Required: Calculate the following ratios and percentages
-
Current ratio
-
Return on total assets
-
Sales to total assets
-
Acid-test ratio
-
Times interest earned
-
Earnings per common share
-
Accounts receivable collection period
-
Return on equity
The following data are taken from the records of Cronkite Corp.:
| 2012 | 2011 | ||
| Sales | $2,520 | $1,440 | |
|
Cost of Goods Sold
|
1,890 | 960 | |
| Gross Profit | 630 | 480 | |
| Other Expenses | 510 | 430 | |
| Net Income | $
120 |
$
50 |
Required: Perform horizontal analysis on the above date and interpret your results.
Assume you are an accountant analysing Escalade Corporation. Escalade has expanded its production facilities by 200% since 2010. Its income statements for the last three years are as follows:
| Escalade Corporation | |||||
| Comparative Income Statements | |||||
| For the Years Ending December 31 | |||||
| 2012 | 2011 | 2010 | |||
| Sales | $250 | $150 | $120 | ||
|
Cost of Goods Sold
|
190 | 100 | 60 | ||
| Gross Profit | 60 | 50 | 60 | ||
|
Other Expenses |
35 | 34 | 35 | ||
| Net Income | $
25 |
$
16 |
$
25 |
||
Required:
-
Prepare a vertical analysis of Escalade Corporation’s income statement for the three years.
-
What inferences can be drawn from this analysis?
The following information is taken from the partial balance sheet of Quail Productions Corp.
| 2018 | 2017 | |||||
| Current assets | ||||||
|
Cash |
$ | 10 | $ | 15 | ||
|
Marketable investments |
35 | 35 | ||||
|
Accounts receivable |
200 | 150 | ||||
|
Inventory |
600 | 400 | ||||
| Current liabilities | ||||||
|
Accounts payable |
500 | 400 | ||||
|
Borrowings |
245 | 180 | ||||
Required:
-
Describe the purpose of and calculate the current ratio for each year.
-
Describe the purpose of and calculate the acid-test ratio for both years.
-
What observations can you make from a comparison of the two types of ratios?
The following information is taken from the records of Black Spruce Co. Ltd.:
| 2019 | 2018 | 2017 | |||||||
| Sales | $ | 252 | $ | 141 | $ | 120 | |||
| Gross profit | 63 | 48 | 54 | ||||||
| Net income | 12 | 5 | 15 | ||||||
Required: Analyse the gross profit and net profit ratios using the above data. Comment on any trends that you observe.
In the left-hand column, a series of independent transactions is listed. In the right-hand column, a series of ratios is listed.
| Transaction | Ratio | Effect on ratio |
| Declared a cash dividend | Current ratio | |
| Wrote-off an uncollectible account receivable | Accounts receivable collection period | |
| Purchased inventory on account | Acid-test ratio | |
| Issued 10-year bonds to acquire property, plant, and equipment | Return on total assets | |
| Issued additional shares for cash | Debt to shareholders’ equity ratio | |
| Declared a share dividend on common shares | Earnings per share | |
| Purchased supplies on account | Current ratio | |
| Paid a current creditor in full | Acid-test ratio | |
| Paid an account payable | Number of days of sales in inventory |
Required: For each transaction indicate whether the ratio will increase (I), decrease (D), or remain unchanged (No Change). Assume all ratios are greater than 1:1 before each transaction where applicable.
Consider the following financial statement data:
| Balance Sheet | |||
| Cash | $ | 20 | |
| Accounts receivable | 20 | ||
| Merchandise inventory | 40 | ||
| Plant, at carrying amount | 140 | ||
| $ | 220 | ||
| Accounts payable | $ | 20 | |
| Non-current borrowings | 60 | ||
| Common shares (8 shares issued) | 80 | ||
| Retained earnings | 60 | ||
| $ | 220 | ||
| Income Statement | |||
| Sales | $ | 100 | |
| Cost of goods sold | 50 | ||
| Gross profit | 50 | ||
|
Operating expenses |
14 | ||
| Income from operations | 36 | ||
|
Less: Interest |
6 | ||
| Income before income taxes | 30 | ||
|
Less: Income taxes |
10 | ||
| Net income | $ | 20 | |
Assume that the average of all balance sheet items is equal to the year-end figure and that all sales are on credit.
Required:
-
Calculate the following ratios:
-
Return on total assets (assume interest has been paid)
-
Return on shareholders’ equity
-
Times interest earned ratio
-
Earnings per share
-
Number of days of sales in inventory
-
Accounts receivable collection period
-
Sales to total assets ratio
-
Current ratio
-
Acid-test ratio
-
Debt to shareholders’ equity ratio.
-
-
Which of these ratios are measures of liquidity?
Assume a company has the following financial information:
| Cash and short-term investments | $ | 6 | |
| Prepaid expenses | -0- | ||
| Capital assets | 90 | ||
| Total liabilities | 40 | ||
| Shareholders’ equity | 140 | ||
| Sales | 420 | ||
| Credit sales | 300 | ||
| Current ratio | 2.5:1 | ||
| Acid-test ratio | 1:1 | ||
| Gross profit ratio | 30% |
Assume current assets consist of cash, short-term investments, accounts receivable, inventory, and prepaid expenses, and that ending balances are the same as average balances for the year.
Required: Calculate
-
Current liabilities
-
Inventory
-
Accounts receivable collection period
-
Number of days of sales in inventory
-
Revenue operating cycle
A company began the month of May with $200,000 of current assets, a 2.5 to 1 current ratio, and a 1.25 to 1 acid-test ratio. During the month, it completed the following transactions:
| Effect on | ||
| Transaction | current ratio | |
| i. | Bought $20,000 of merchandize on account (the company uses a perpetual inventory system) | |
| ii. | Sold for $10,000 cash, merchandize that cost $5,000 | |
| iii. | Collected a $2,500 account receivable | |
| iv. | Paid a $10,000 account payable | |
| v. | Wrote off a $1,500 bad debt against the allowance for doubtful accounts | |
| vi. | Declared a $1 per-share cash dividend on the 10,000 outstanding common shares | |
| vii. | Paid the dividend declared above | |
| viii. | Borrowed $10,000 from a bank by assuming a 60-day, 10-per cent loan | |
| ix. | Borrowed $25,000 from a bank by placing a 10-year mortgage on the plant | |
| x. | Used the $25,000 proceeds of the mortgage to buy additional machinery |
Required:
-
Indicate the effect on current ratio assuming each transaction is independent of the others: Increase, Decrease, or No Change.
-
At the end of May, and taking all the above transactions into account, what was the current ratio and acid-test ratio?
Use the following format. The opening current ratio calculation and effects of the first transaction are provided:
Current ratio:
| Bal | Bal | ||||||||||||
| In thousands of dollars | May 1 | i | ii | iii | iv | v | vi | vii | vii | ix | x | May 31 | |
| Current assets | x | 200 | +20 | ||||||||||
| Current liabilities | y | 80 | +20 | ||||||||||
| Current ratio | x/y | 2.5 |
Acid-test ratio:
| Bal | Bal | ||||||||||||
| In thousands of dollars | May 1 | i | ii | iii | iv | v | vi | vii | viii | ix | x | May 31 | |
| Quick assets | x | ||||||||||||
| Current liabilities | y | ||||||||||||
| Acid-test ratio | x/y |
Problems
Belafonte Corporation’s books were destroyed in a fire on April 20, 2011. The comptroller of the corporation can only remember a few odd pieces of information:
-
The current ratio was 3.75 to 1.
-
Sales for the year were $73,000.
-
Inventories were $20,000 and were equal to property, plant and equipment at carrying amount, and also equal to bonds payable.
-
The accounts receivable collection period was 40 days.
-
The bonds payable amount was 10 times cash.
-
Total current assets were twice as much as common shares.
Required: Using this information, prepare Belafonte Corporation’s balance sheet at April 30, 2011. Assume balances at April 30, 2011 are the same as average balances for the year then ended, and besides retained earnings, there are no accounts other than those mentioned above.
The incomplete balance sheet of Hook Limited is given below.
| Hook Limited | |||
| Balance Sheet | |||
| At December 31, 2011 | |||
| Assets | |||
| Current | |||
|
Cash |
$30,000 | ||
|
Accounts Receivable |
? | ||
|
Merchandise Inventory |
? | ||
| $
? |
|||
|
Property, plant and equipment assets
|
? | ||
|
Less: Accumulated Depreciation |
100,000 | ? | |
| Total Assets | $
? |
||
| Liabilities | |||
| Current | |||
|
Accounts Payable |
$50,000 | ||
|
Accrued Liabilities |
? | ||
| $120,000 | |||
| Non-current | |||
|
8% Bonds Payable |
? | ||
| Equity | |||
|
Common Shares |
? | ||
|
Retained Earnings |
? | ||
| Total Liabilities and Equity | $
? |
||
Additional information for 2011 year-end:
-
The amount of working capital is $150,000.
-
The issued value of the shares is $10 per share.
-
Market price per share is $15.
-
Price-earnings ratio is 3.
-
Income before payment of interest and income tax is $80,000.
-
The ratio of shareholder’s equity to total assets is 0.60 to 1.
-
Income tax expense equals $30,000.
-
The acid-test ratio is 1.5 to 1.
-
The times interest earned ratio is 8 to1.
Required: Complete Hook Limited’s balance sheet.
1. Any ratio in the form X:1 can be expressed as a percentage by multiplying both the numerator and denominator by 100. For example, a 0.25:1 ratio would equal 25% [![]() ]
]
2. Average balance sheet amounts are used when income statement amounts are compared to balance sheet amounts in a ratio. This is because the income statement item is realized over a fiscal year, while balance sheet amounts are recorded at points in time at the end of each fiscal year. Averaging opening and ending balance sheet amounts is an attempt to match numerators and denominators to an approximate midpoint in the fiscal year.
3. ($420 + 544)/2 = $482
4. ($257 + 420)/2 = $338.5
5. ($503 + 833)/2 = $668
6. ($361 + 503)/2 = $432
7. ($2,112 + 2,486)/2 = $2,299
8. ($1,417 + 2,112)/2 = $1,764.50
9. ($2,112 + 2,486)/2 = $2,299
10. ($1,417 + 2,112)/2 = $1,764.50
11. ($1,195 + 1,231)/2 = $1,213
12. ($1,048 + 1,195)/2 = $1,121.50
