Overview of Geological Structures Part 1: Strike, Dip, and Structural Cross-Sections
Adapted by Joyce M. McBeth, Karla Panchuk, Lyndsay R. Hauber, Tim C. Prokopiuk, & Sean W. Lacey (2018) University of Saskatchewan from Deline B, Harris R & Tefend K. (2015) “Laboratory Manual for Introductory Geology”. First Edition. Chapter 12 “Crustal Deformation” by Randa Harris and Bradley Deline, CC BY-SA 4.0. View source. Last edited: 8 Jan 2020
In Part I of geological structures, students will learn how to interpret strike and dip information from a geological map, prepare a geological cross-section from a plan-view geological map, and measure the thicknesses of geological units.
8.2 STRIKE & DIP
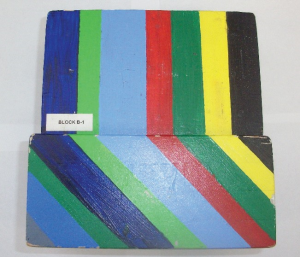
To learn many of the concepts associated with structural geology, it is useful to look at block diagrams and block models. Block diagrams are images based on three-dimensional (3-D) block models, which are blocks of wood or paper with geological structures marked on them. Block models and block diagrams assist in visualizing how 3-D geological structures in the real world can be represented in two dimensions on a map or in a geological cross-section.
As you examine the block diagrams in the figures in this section, note the different ways that you can view them: from above, or from the sides. If you look at a block from along the side, you are seeing the cross-section view. This is the view of geological structures you also see when you drive through the mountains and the roads have been cut through the rocks, exposing structures in the rock that you wouldn’t see otherwise. If you look at the block from directly above, you are looking at the map or plan view (Figure 8.3).
Source: Randa Harris (2015) CC BY-SA 3.0 view source
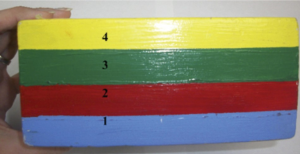
As you look at geological maps and drawings and try to figure out about how rocks have changed when they are tilted and/or deformed, it is useful to remember how they were deposited in the first place. Let’s briefly review some of the geological laws that you learned in the chapter on relative and absolute dating. Sedimentary rocks, under the influence of gravity, will deposit in horizontal layers (principle of original horizontality). The oldest rocks will be on the bottom (because they had to be there first for the others to deposit on top of them), and are numbered with the oldest being #1 (law of superposition). The wooden block in Figure 8.4 (a cross-section view of sedimentary layers) provides an example of the principle of original horizontality and the law of superposition.
Source: Randa Harris (2015) CC BY-SA 3.0 view source
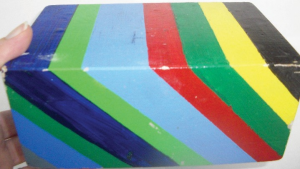
Each of the boundaries between the colored rock units in Figure 8.4 represents a geological contact, which is the planar surface between two adjacent rock units. Earth’s rock layers are often complicated: rock layers are often tilted at an angle, not horizontal – this indicates that changes have occurred since deposition (e.g., the rocks have been uplifted by tectonic activity and tilted). Figure 8.5 is a block model example of tilted rocks. Which color bed in the block model is the oldest? Given the law of superposition and the principle of original horizontality, it is more likely that the gray bed on the bottom left side of the block was the bottom bed during deposition, and therefore the oldest. In some circumstances, beds can be completely overturned (for example in recumbent folds); if this was the case, the grey bed would be the youngest bed in figure 8.5. In the lab exercises for this chapter we will not have any exercises with overturned beds.
Source: Randa Harris (2015) CC BY-SA 3.0 view source
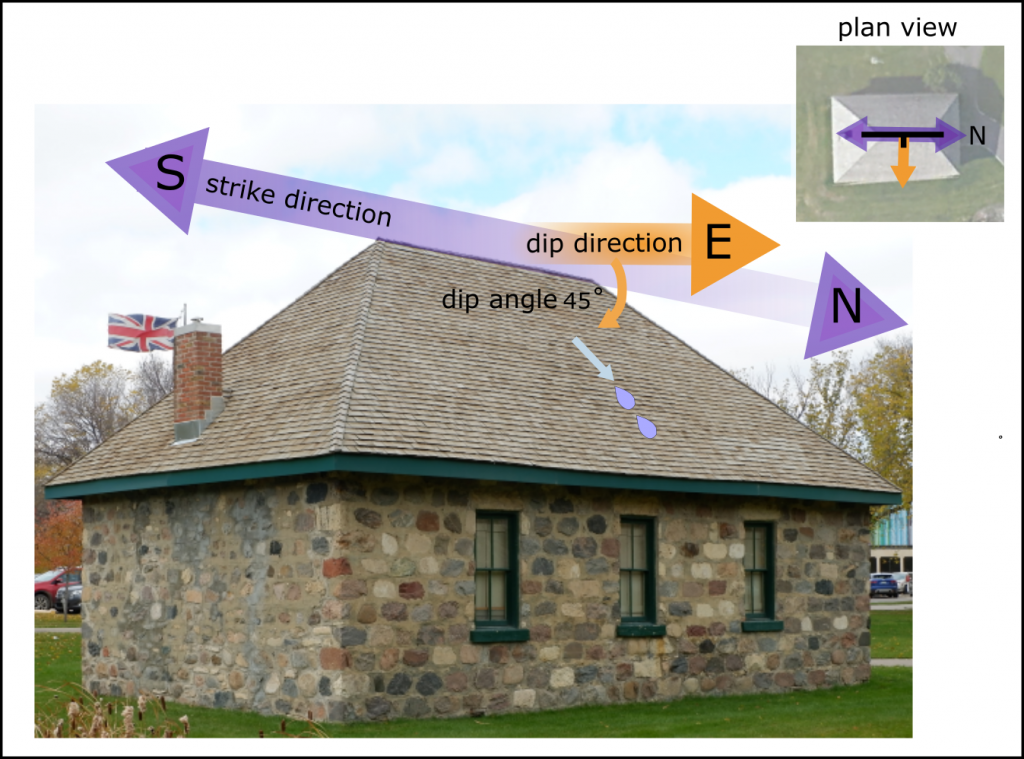
To measure and describe the geometry of geological layers, geologists apply the concepts of strike and dip. Strike refers to the line formed by the intersection of a horizontal plane and an inclined surface. This line is called a strike line, and the direction the line points in (either direction, as a line points in two opposite directions) is the strike angle. Dip is the angle between that horizontal plane (such as the top of the block in figure 8.5) and the inclined surface (such as a geological contact between tilted layers) measured perpendicular to the strike line down to the inclined surface. A useful way to think about strike and dip is to look at the roof of a house (Figure 8.6). A house’s roof has a ridge along the top, and then sides that slope away from the ridge. The ridge is like a strike line, and the angle that the roof tilts is the dip of the roof.
Source: Joyce M. McBeth (2018) CC BY-SA 4.0. Satellite image from © 2018 Google Earth.
Figure 8.7 illustrates strike and dip for tilted flat sedimentary layers. The line of strike is represented by the water line when a lake intersects with the rock along the shoreline (Figure 8.7). The dip angle for the beds is measured from the horizontal surface to the uppermost dipping bed, perpendicular to the strike line.
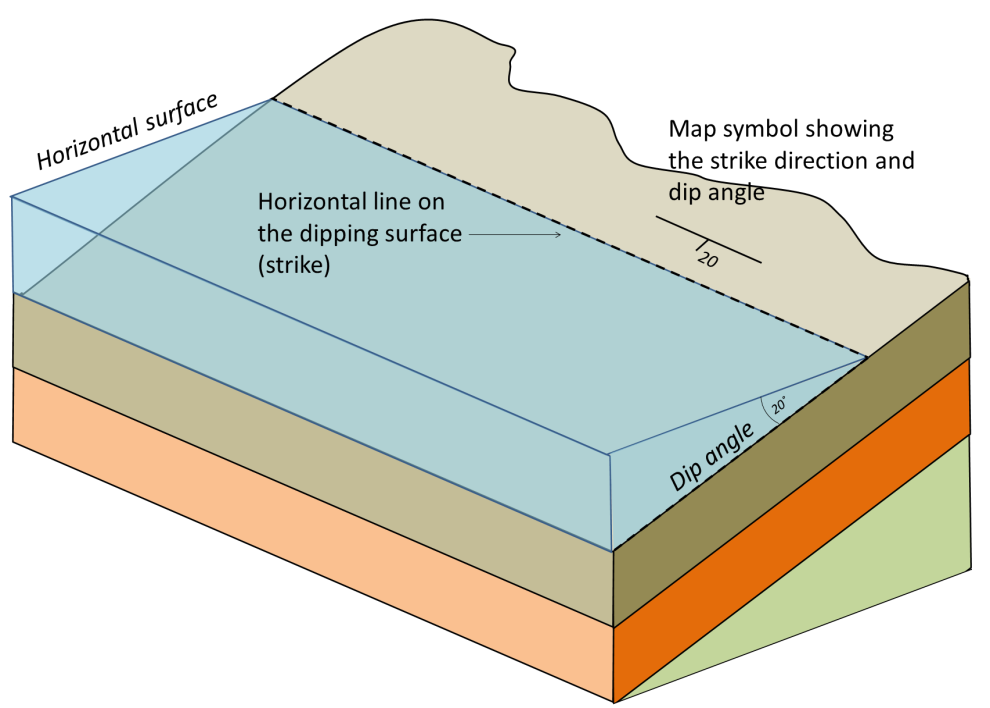
Source: Karla Panchuk (2018) CC BY 4.0. Modified after Steven Earle (2015) CC BY 4.0 view source
Now, let’s apply this concept to the block of dipping beds in Figure 8.5. To find a strike line, find where a contact intersects the horizontal surface. Each dipping contact intersects the horizontal surface in a horizontal line, so there are many strike lines to choose from. To determine dip, pretend that there is a drop of water between one bed and the next, for example, along the intersection of the pale blue bed and the red bed. In which direction would the water roll if it followed that contact? That is the direction of dip — here, it is towards the right side of the figure. Note that the dip symbol (shorter line) should be drawn perpendicular to the strike symbol, whatever the angle of dip (Figure 8.8).
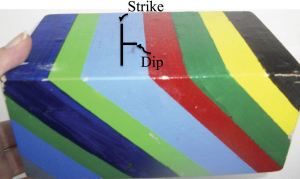
Source: Randa Harris (2015) CC BY-SA 3.0 view source
The rule of Vs for contour lines that we discussed in the topographic maps section of this lab manual is also useful for interpreting the direction that beds and other geological structures (e.g., faults) are tilted on maps. The law of Vs for geological structures is more complicated than the rule of Vs for contour lines since there is an additional layer of complexity when we add in the geology. You can usually determine the dip direction of inclined beds by looking at the direction of the V that forms when the bed crosses a valley on a map. This resulting V may or may not point in the direction the bed dips, depending on the slope of the valley. For vertical beds, no V shape is created in map view: the bed cuts directly across the valley without being deflected in either direction (Figure 8.9 A/B). For inclined beds if the bed dips in the opposite direction as the slope of the valley, the V will point in the direction of dip (Figure 8.9 E/F). The situation is more complex when the beds dip in the same direction that the valley slopes. If the dip of the beds is steeper than the slope of the valley, then the V will point in the direction of dip (8.9 C/D). But if the valley slopes steeper than the dip of the beds, the V will point in the opposite direction of dip (example not shown in Figure 8.9). For horizontal beds the edge of the bed will intersect topography parallel to topographic contours. If the landscape is flat near the valley, the bed will intersect in a straight line along the edge of the valley (Figure 8.9 G/H). If the landscape is sloping near the valley, the bed will generate a V shape parallel to the contour lines in the valley (I/J).
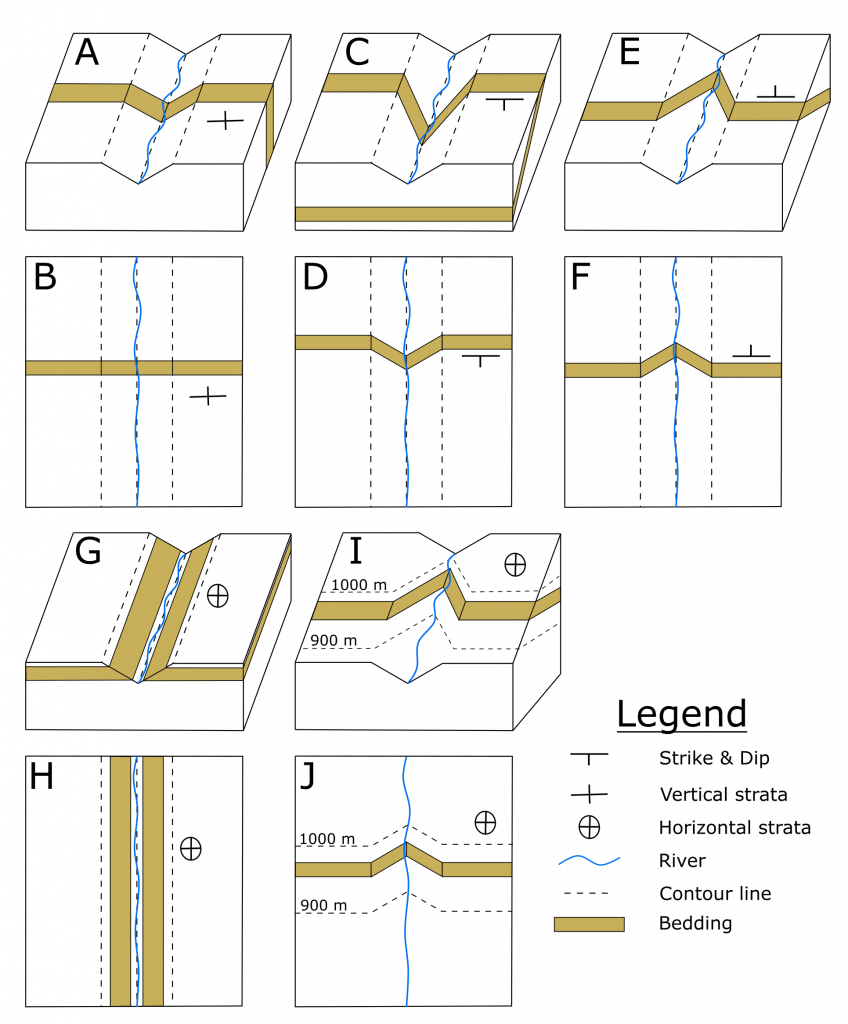
Source: Lyndsay Hauber & Joyce McBeth (2018) CC BY 4.0, original work.
In the law of Vs, vertical and horizontal beds generate unique patterns when they intersect with the surface of Earth. Figure 8.10 provides another illustration of these patterns, this time for a symmetrical hill. Not that in the case of the vertical beds (Figure 8.10A), there are no Vs produced in the landscape, and the feature is linear across the landscape despite the changes in the topography. We would see the same pattern in the landscape for vertical faults or other vertical geological features. In the case of horizontal beds (Figure 8.10B), the strata intersect with the topography in lines that are parallel to the contour lines. What pattern would you expect to see if a stream ran through Figure 8.10B and partially eroded into the slope? Hint: see Figure 8.9 I and J.
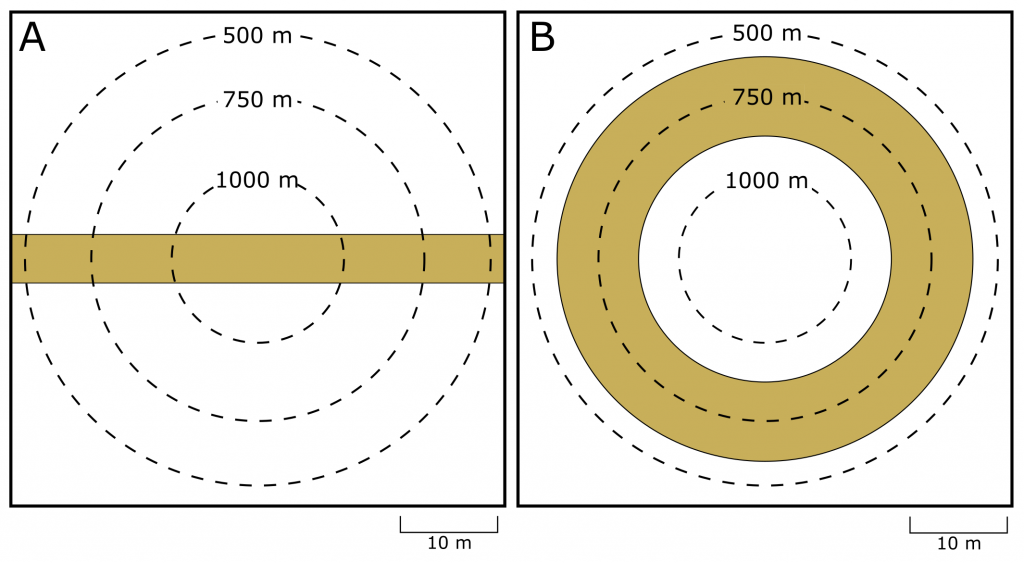
Source: Lyndsay Hauber & Joyce M. McBeth (2018) CC BY 4.0 original work.
8.3 GEOLOGICAL MAPS & CROSS-SECTIONS
A geological map uses lines, symbols, and colors to communicate information about the nature and distribution of rock units within an area. The map includes information about geological contacts and their strikes and dips. Geologists make these maps by careful field observations at numerous outcrops (exposed rocks at Earth’s surface) throughout the mapping area. At each outcrop, geologists record information such as rock type and the strike and dip of the rock layers. They can also include relative age data in their map if they are able to find evidence of relationships between the rocks using the principles of relative dating. Geological maps take practice to understand, because three-dimensional features (including complex features such as folds) are displayed on a two-dimensional surface. Remember that a geological map will be seen in map view, i.e., they are viewed from above. A geological map is analogous to viewing a floor plan to a house – there are many things you can represent in plan view (e.g., doors, appliances, stairs) that will help you visualize what the interior will look like if you were to visit the house in real life.
Geologists use information about rocks that are exposed to visualize how the unseen rocks beneath the surface are oriented. This allows geologists to prepare their best interpretation of the cross-sectional view of the geology below the surface, similar to what we observed in the blocks above.
A geological cross-section shows geologic features from the side view (the side views of the block diagrams in Figures 8.3-8.5 are cross-sections). They are similar to the topographic profiles that you created in the topographic maps chapter, but they also show the rock types and geologic structures present beneath Earth’s surface.
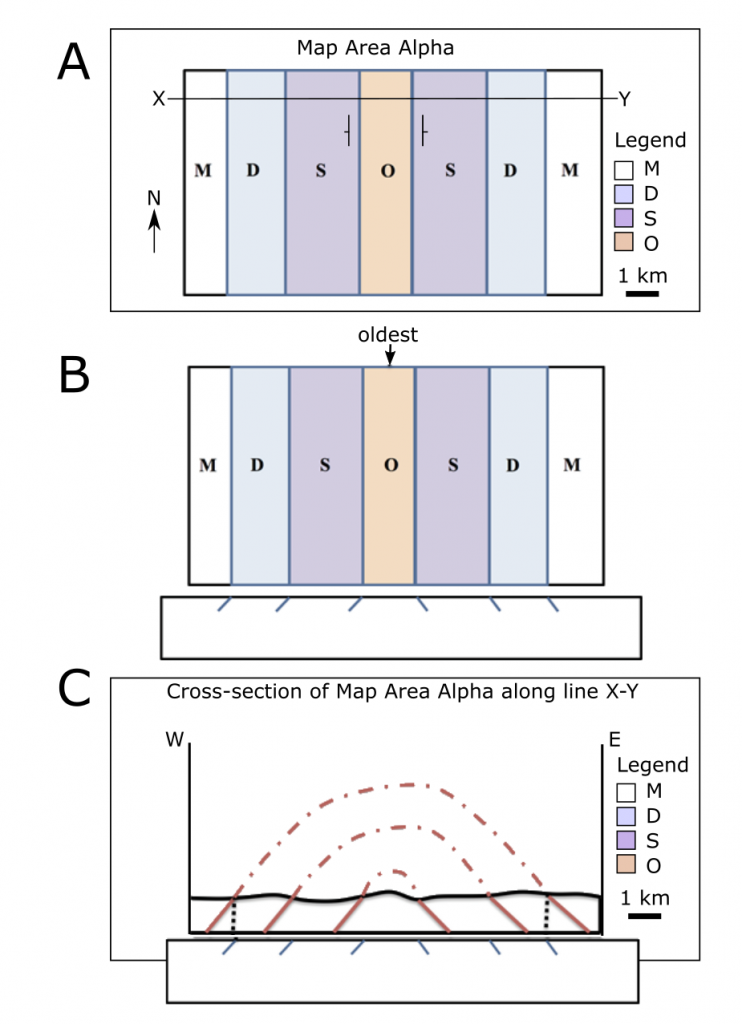
There are four things to include on every geological cross-section: a legend, the orientation of the line the cross-section represents on the map, a title, and a scale (e.g., Figure 8.11C). To help us remember, we abbreviate these four key parts with the acronym L.O.T.S.
Legend – the legend is a key to the patterns used to identify each unit on the cross-section. The units are ordered from oldest formation at the bottom of the legend to youngest unit at the top of the legend.
Orientation – the orientation of the cross-section is the direction that the cross-section line makes on Earth (the “strike” direction of the cross-section line on the geological map). You can indicate the orientation by writing the corresponding direction at each end of the cross-section (e.g., west and east on Figure 8.11C).
Title – a descriptive title for the cross-section. You can include the letters used to identify the line on the original geological map in the title (e.g., Cross-Section along Line X-Y in Figure 8.11C).
Scale – include a ratio scale and/or a bar scale to show the scale of the cross-section. The vertical and horizonal scales should be the same, so you only need to include one scale on the cross-section.
Figure 8.11 provides an example of a simple geological cross-section. To construct a geological cross-section, follow these steps:
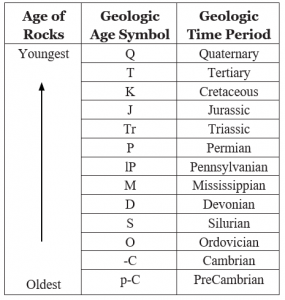
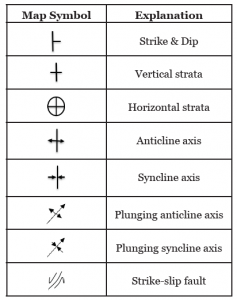
- Carefully look at the geological map that you are using to construct your cross-section (e.g., Figure 8.11A). Pay close attention to any strike and dip symbols, geological contacts, and ages of the rock types (Figures 8.12 and 8.13 have examples of rock age abbreviations and common structural symbols used on geological maps).
- Identify the position on the map designated for the cross-section. The line will be indicated by an actual line, or with positions labelled with letters on the edges of the map, e.g., “X” and “Y”.
- Take a clean sheet of paper, and line it up along the line on the plan view map (Figure 8.11B). At each geological contact, make a mark on the edge of the paper.
- Using any strike and dip symbols on the map, add the dip onto the marks on your piece of paper, showing the direction the rocks are dipping, and note the angle of dip for each position.
- If strike and dip symbols are not provided but based on the Law of Vs or the ages of the beds you are able to determine that there are dipping or vertical structures present, include these as corresponding marks on your paper. Use your best interpretation of the dip direction if dips are not given on the geological map.
- Transfer the marks from your paper to the bottom of the cross-section diagram provided (Figure 8.11C). You can prepare your own cross-section diagram based on the example in the exercises section of this chapter. The x-axis of the diagram will be the distance along the line on the map, and the z-axis will be the elevation of the rocks (usually measured relative to sea level or another benchmark).
- Draw the topography on the cross-section (just as you did in the exercises in the topographic maps chapter). Note that in the example in figure 8.11 the map area is flat.
- Transfer the marks from along the edge of your piece of paper to the points along the line where they intersect with the topography. These are the points where the geological structures are exposed at the surface.
- Sketch the structures into your cross-section, starting at the points where the structures meet the topographic surface. Pay careful attention to dip angles (if they were provided). Structures may be drawn in with a dotted line above Earth’s surface to indicate rocks that were formerly present but that have since been eroded (e.g., Figure 8.11C). You can also use dashed lines to indicate the position of the bottom of beds when you don’t have any evidence for their thickness or if you have some basis to know that they will end within the cross-section, e.g., sedimentary beds overlying metamorphic basement rock that is exposed elsewhere in the region.
- Don’t forget L.O.T.S.! Add a legend, orientation, title, and scale to your cross-section (Figure 8.11C). Ensure your units and legend on the cross-section use the same colour or pattern scheme as on the original geological map.
Source: Joyce M. McBeth (2018) CC BY-SA 4.0, after Randa Harris (2015) CC BY-SA 3.0 view source
8.4 CALCULATING BED THICKNESSES
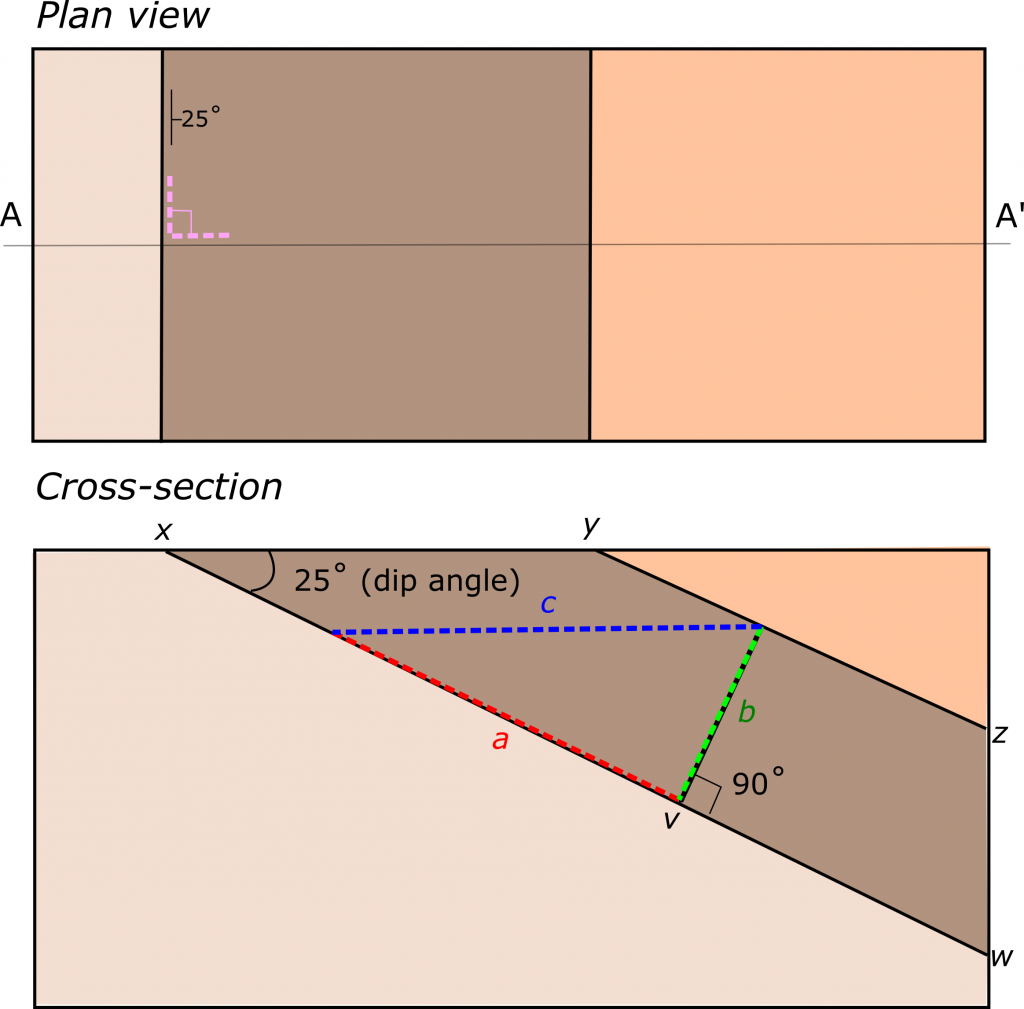
As you study Figure 8.11 and work though the exercises in this lab, you will notice that the thicknesses of the sedimentary beds in the plan-view map (viewed from overhead) are different from the thicknesses of these beds in the cross-section view. Generally, the cross-section view will show that the true thicknesses of the beds are thinner than what they appear to be in plan-view, the latter of which would be an apparent thickness. But true thicknesses are only displayed in cross-sections that are constructed perpendicular to strike. Any other cross-sectional view will also result in a distorted or apparent thickness that appears thicker than the true thickness of the bed.
Figure 8.14 illustrates why we see this difference. The line marked y-z represents the upper contact of the bed (where the sedimentary bed comes in contact with the bed above it), and the line marked x-w represents the lower contact (where the sedimentary bed comes in contact with the bed below it). The beds are inclined in the figure, so the length of the distance between x and y (labelled “c”) is longer than the shortest distance between the upper and lower contacts (labelled “b”). If you know the angle that the beds are dipping and the distance between x and y, you can calculate the thickness of the beds using trigonometry. Providing that you draw the map to the same scale in all directions (i.e., not exaggerated on the vertical axis) you can also directly measure the distance between the bottom of the bed and the top of the bed using a ruler and the scale of the cross-section to get the true thickness. Remember that when using a cross-section to measure the true thickness of a bed, that the cross-section must be drawn perpendicular to the strike of the beds (illustrated in the plan view map in Figure 8.14).
In situations where the beds are vertical (dip = 90˚), the thickness of the bed is equal to the distance between the upper and lower contact of the bed as measured directly on the geological map. If the beds are horizontal (dip = 0˚) and there is enough topography that both the upper and lower contacts are exposed, the thickness of the beds can be measured by calculating the difference in elevation between the upper and lower contacts.
Source: Joyce M. McBeth (2018) CC BY 4.0, original work.

